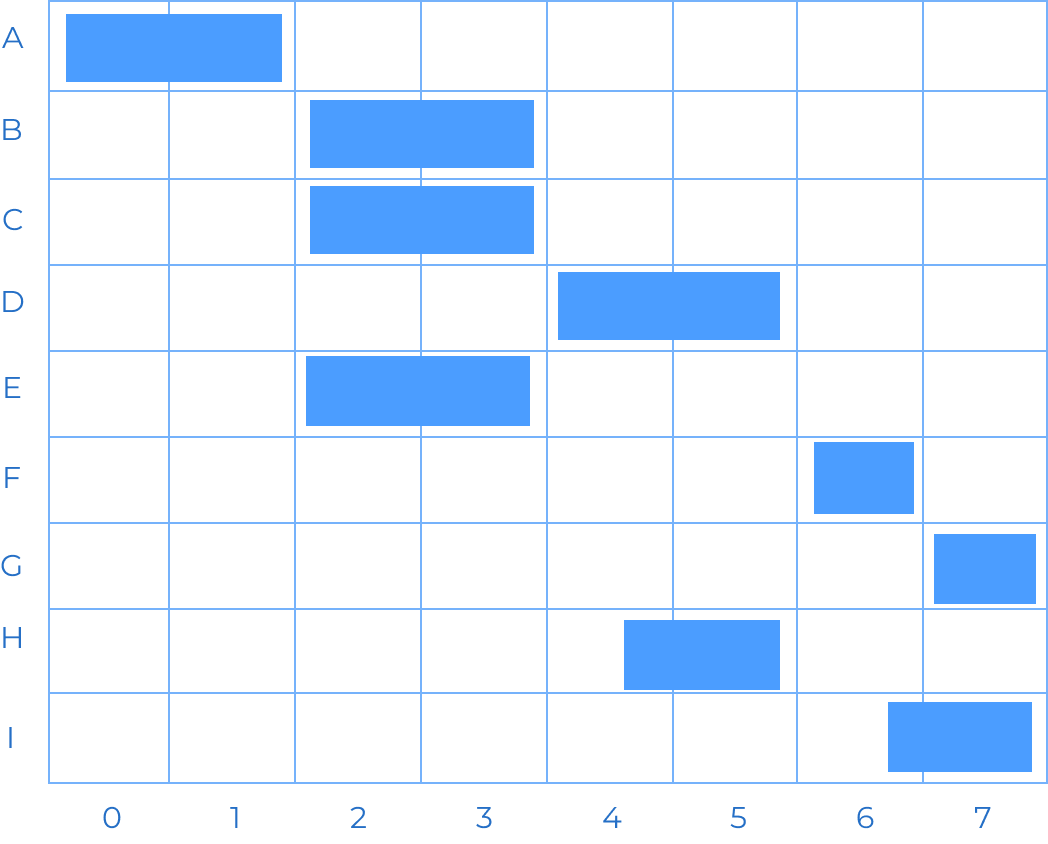

A step-by-step guide for creating a Donut Chart through QuickGraphAI Editor:


QuickGraph AI Editor transformed how we present data. The AI-powered insights and seamless interactive editor make complex visualizations effortless and dynamic. It was like having a data scientist and a designer in one tool!

Explore our insightful blog posts

All Rights Reserved. © 2026 by QuickGraph.