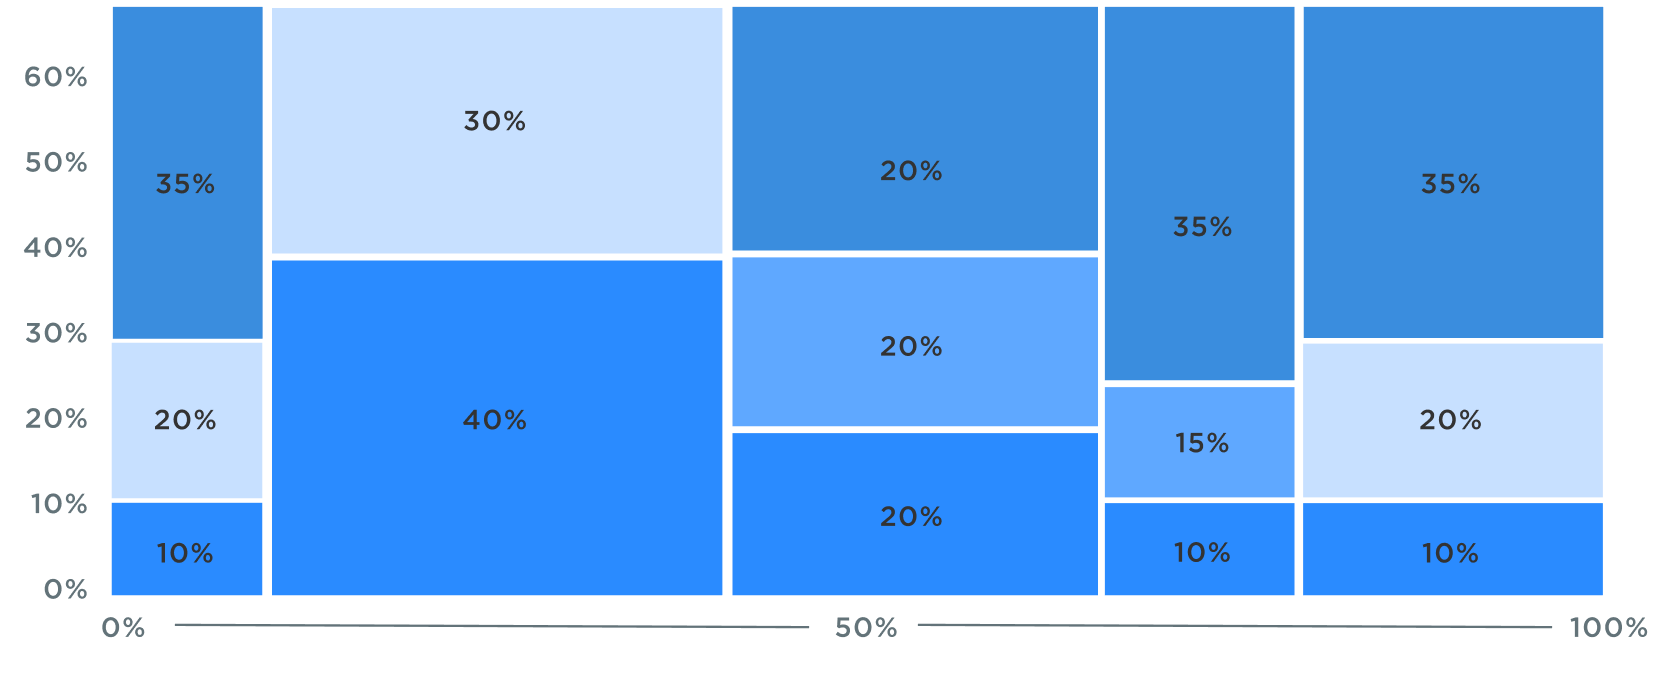
Create Marimekko Chart Online Free

If you’re looking to create a Marimekko chart or explore the versatility of mosaic plots, our tools make it easy and intuitive for you.

Visualize Your Data with QuickGraph AI's Mekko Charts!

Our cutting-edge platform lets you create stunning mekko charts and Marimekko Chart with just a few clicks. Our user-friendly tools guide you on how to create a mekko chart effortlessly. Dive into the vibrant world of mosaic plot and mosaic charts, and see your data in a whole new light with our mosaic graph solutions. With our mosaic plot maker and mosaic plot generator, turning complex data into beautiful visuals has never been easier. Discover the magic of our mekko charts maker and elevate your data storytelling to new heights.
Explore our Visual Market Analysis Chart options and bring clarity to your market data. Our Market Share Chart and Variable Column Width Chart tools allow you to present data dynamically and accurately. Experience the next level of data visualization with our Proportional Stacked Bar Chart, providing a comprehensive view of segmented information. From creating a Variable Width Bar Chart to a Segmented Bar Chart, our platform ensures precision and ease. With QuickGraph AI, you can craft intricate charts that simplify complex data and deliver meaningful insights.
Start creating your customized charts today and make your data speak volumes!
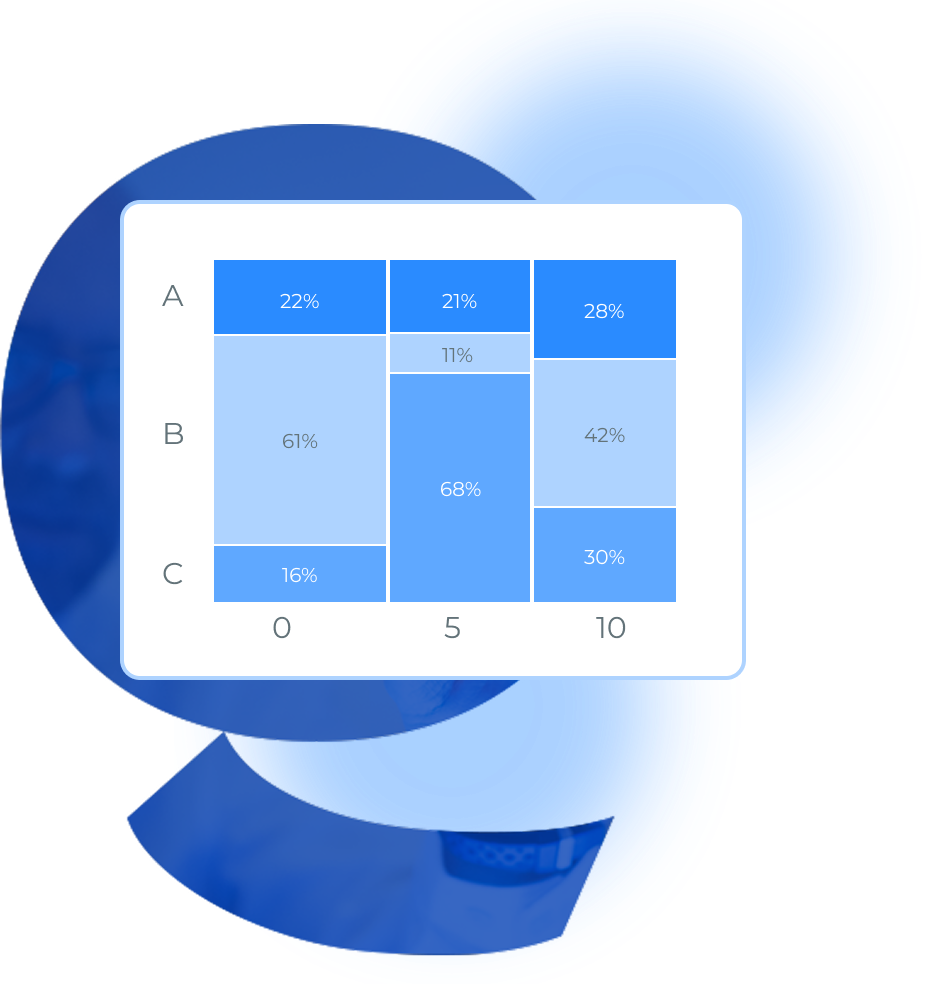
Key Features Of Mekko Chart

Mekko charts, also known as marimekko charts, allow you to visualize complex data sets in a single, comprehensive chart. This makes it manageable to determine patterns and trends.
One of the unique aspects of mekko charts is the proportional widths of the bars, which represent different categories. This feature helps in understanding the relative importance of each category.
Mekko charts provide detailed segmentation within each bar, allowing you to break down data into sub-categories. This is particularly useful for in-depth analysis.
With QuickGraph AI, you can easily create a mekko chart using our intuitive tools. Our platform guides you on how to create a mekko chart step-by-step, ensuring a smooth and efficient process.
Mekko charts can be integrated with mosaic plots and mosaic charts to provide a more detailed and layered view of your data. Our mosaic graph solutions enhance your data visualization capabilities.
Use our mosaic plot maker and mosaic plot generator to customize your mekko charts to fit your specific needs. Our mekko charts maker offers a range of templates and automation features to streamline your data visualization process.

Create a Mekko Chart Online

Effortlessly design and customize your own Mekko charts with QuickGraph AI.

Process of Making a Mekko Chart

A step-by-step guide for creating a Donut Chart through QuickGraphAI Editor:

01

line

Define Your Data Categories

Identify two variables: one for the bar width (e.g., regions) and another for the proportions within each bar (e.g., product share). This step differentiates a Mekko Chart from a Proportional Bar Chart, which only shows fixed-width bars with internal proportions.

02

line

Organize Your Data

Structure your dataset to include categories, total values for bar width, subcategories, and their proportions. Proper data organization ensures accurate and meaningful visualization.

03

line

Choose a Visualization Tool

Select a tool like Excel, Google Sheets, Tableau, or Power BI to create the Mekko Chart. Each platform offers unique features for building and customizing your chart.

04

line

Create the Mekko Chart

Input your data into a stacked bar chart and adjust the axis to reflect proportional bar widths. This transforms a regular stacked bar into a Mekko Chart.

05

Customize the Chart

Enhance clarity by adding distinct colors, axis labels, and a legend to explain the data breakdown. Customization improves chart readability and interpretation.

Significance of Mekko Chart

Frequently Asked Questions

A Mekko Chart, or Marimekko Chart, is a bar chart in which the value of each bar is represented by its width. The main difference between Mekko Charts and regular bar charts is that Mekko Charts provide information with both width and height, and thus are best used for the display of complicated data sets with several variables.
Yes! You can integrate Mekko Charts into mosaic plots, mosaic charts, and other kinds of visualizations using QuickGraph AI. Integrate and enjoy a more informative view of your data, unveiling more insights!.
Mekko Charts are effective data analysis tools because they give you a proportional and detailed representation of data. They assist in detecting patterns, trends, and correlations in complex data sets. You can make better decisions based on your data by utilizing Mekko Charts.
Indeed, QuickGraph AI's mosaic plot creator and others' automation aspects enable you to make the creation process more efficient. You may establish templates and automate repetitive functions, which simplify generating several charts quickly and at ease.
Certainly! You can save your Mekko Chart in different formats (e.g., PNG, PDF) and export it directly from QuickGraph AI. This allows you to easily incorporate your charts into reports, presentations, and other documents.
Donut-Chart-icon
line-graph-icons

Best Mosaic Plot Generator Free.

Automate your data visualization process with our advanced mosaic plot maker online.