
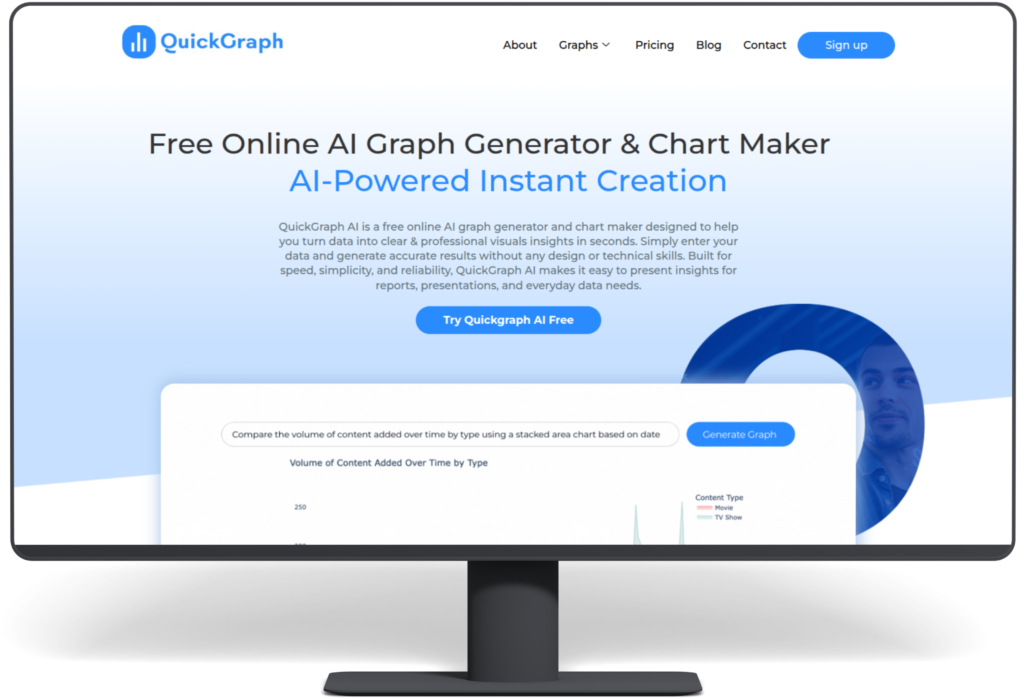
The process of creating charts by hand requires both time and physical work which results in errors during data visualization. The current digital environment demands both accurate results and rapid performance more than any previous time period. The AI Chart Maker is really significant for a paradigm shift in data visualization. This will help you turn raw data into professionally made charts in seconds.
Students, marketers, business owners, and analysts can enhance their work efficiency and data precision through the use of an AI Chart Maker. The following guide provides users with detailed instructions to create AI charts with increased speed and improved precision. The guide provides step-by-step instructions which help users to create AI charts at a faster pace and better accuracy.
Before using any AI Chart Maker, your data must be clean and organized. AI works best when it receives structured input.
Make sure:
Clean data allows the AI Chart Maker to understand patterns quickly and generate accurate visualizations without errors.
Not all tools provide the same level of accuracy or automation. A good AI Chart Maker should:
Choosing the right AI Chart Maker saves time and ensures your charts look professional and reliable.
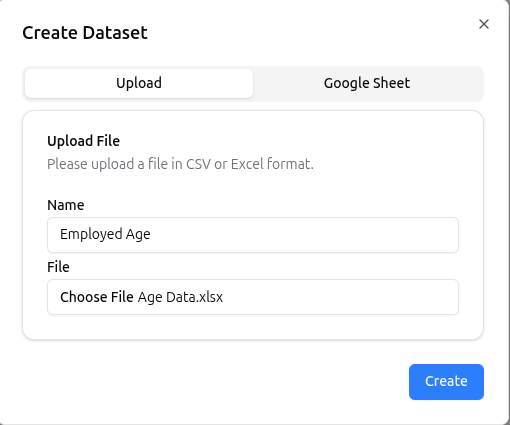
Once your data is ready, upload or paste it into the AI Chart Maker. Most AI-powered tools instantly analyze the dataset.
At this stage, the AI:
This automation removes the need for manual calculations and chart selection.
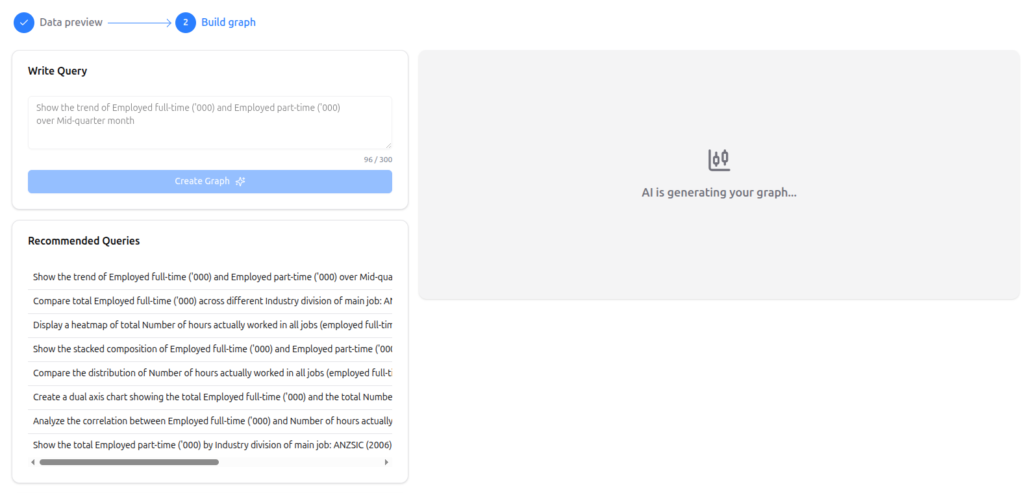
One of the biggest advantages of using an AI Chart Maker is smart chart selection. Instead of guessing which chart works best, AI automatically recommends the most suitable option.
For example:
This step improves accuracy and ensures your data is presented in the most meaningful way.
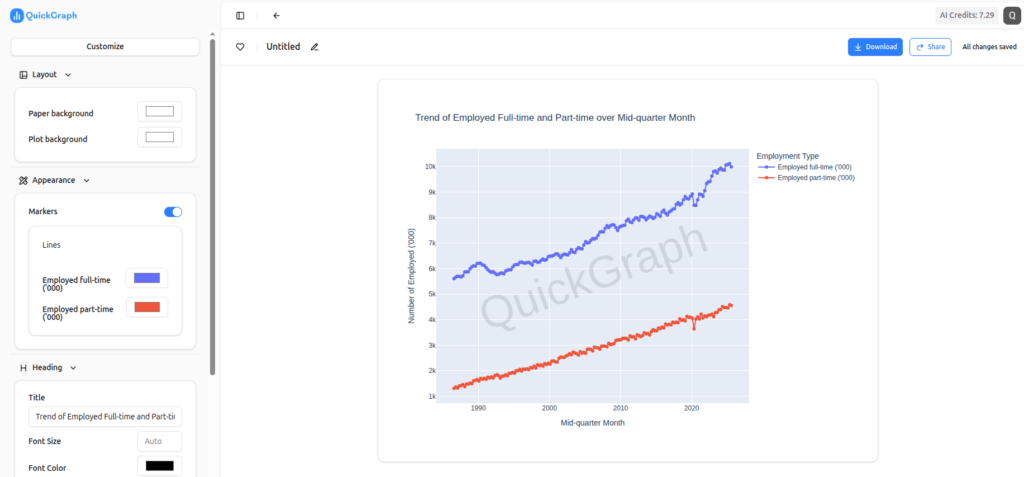
Even though AI handles most of the work, small customizations improve readability and user engagement.
You can:
A good AI Chart Maker allows quick edits without breaking the data structure.
AI reduces errors, but reviewing the final output is still important. Check:
This step ensures the AI Chart Maker has interpreted your data correctly and that your chart is fully accurate.
Once finalized, export your chart in the required format. Most AI Chart Makers support:
This flexibility makes AI charts perfect for content marketing, assignments, business reports, and social media.
Using traditional tools often requires technical skills and extra time. An AI Chart Maker simplifies the entire process.
Key benefits include:
This makes AI chart makers ideal for anyone who works with data regularly.
An AI Chart Maker has become essential because it helps organizations create data visualizations more effectively. The step-by-step methods enable you to create AI charts in a faster and more accurate way while working with less effort.
The best solution for saving time and preventing mistakes while creating professional data presentations involves using an AI Chart Maker. The combination of clean data with intelligent automation and fast customization options enables users to create AI charts with powerful and easy-to-use features.