In today’s digital world, data is everywhere. Businesses track sales, marketers measure campaigns, teachers analyse results, and students study trends. But raw numbers alone are confusing. To truly understand data, you need clear and simple graphs.
This is where AI changes everything.
With an free online AI graph generator like QuickGraph AI, creating professional, accurate, and beautiful graphs becomes fast and easy. You don’t need design skills. You don’t need technical knowledge. You just need your data.
Let’s understand how AI helps you create better graphs and why it can boost your productivity and results.
Before AI tools, creating graphs required:
Many people struggle with selecting the right chart. Should it be a bar graph? Pie chart? Line graph? Scatter plot?
If you choose the wrong one, your message becomes unclear.
Traditional methods are:
This wastes time and reduces the impact of your presentation.
An AI graph maker like QuickGraph AI uses smart technology to understand your data and automatically suggest the best visualization.
Here’s how AI helps:
AI studies your data pattern and suggests the most suitable chart type.
For example:
You don’t have to guess. The tool guides you.
Instead of spending hours designing graphs manually, AI creates them in seconds.
Just:
This is perfect for:
Time saved means more productivity.
Manual chart creation often leads to:
AI reduces these errors by analyzing your data automatically and organizing it properly.
Better accuracy = Better decisions.
Presentation matters.
AI tools like QuickGraph AI create clean, modern, and visually appealing charts. They look professional without needing graphic design skills.
Good visualization:
Whether it’s for a client meeting or classroom presentation, your graphs will stand out.
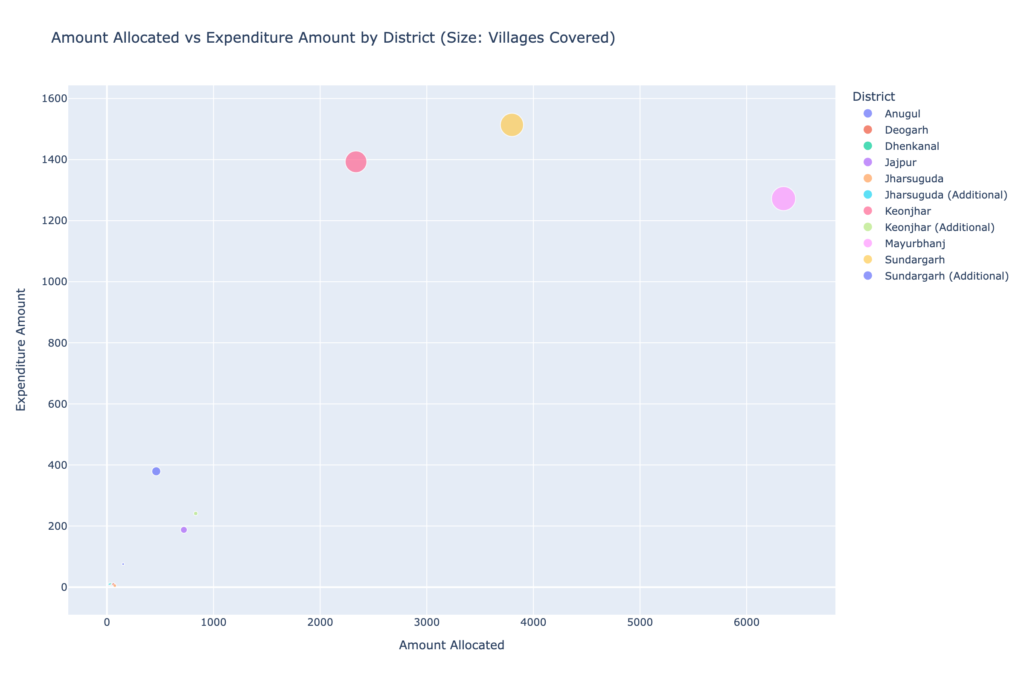
One of the most powerful features of AI graph makers is text-to-graph generation.
You can simply type something like:
“Bubble chart showing Amount Allocated versus Expenditure Amount with bubble size representing the number of Villages Covered per District.”
And the tool creates the visualization automatically.
This makes data visualization easier than ever before.
AI doesn’t just create graphs it helps you understand your data.
Some AI tools:
This helps businesses make smarter decisions faster.
Better graphs lead to better insights.
Companies today want speed, clarity, and results.
Using AI tools gives them:
When data is presented clearly, it builds trust and confidence.
That’s why more businesses are shifting to AI-based solutions like QuickGraph AI.
If you create content for blogs, websites, or social media, AI-generated graphs can increase traffic.
Here’s how:
Search engines prefer content that provides value and clarity. Adding AI-generated graphs makes your content more helpful and informative.
If your goal is full traffic growth, strong visuals are a big advantage.
The best part? Anyone can use it.
No coding. No design skills. No complex software.
Just simple input and smart AI output.
AI is transforming many industries and data visualization is one of them.
In the future:
Tools like QuickGraph AI are leading this change by making graph creation simple, fast, and smart.
Creating graphs should not be difficult.
With an AI graph maker like QuickGraph AI, you can:
AI makes data visualization simple for everyone.
If you want better graphs, smarter insights, and faster results AI is the solution.