Graph creation stands as an essential data analysis task. Graphs serve as effective tools for presenting numerical data in business reports and school projects and marketing analyses and sales presentations.
People have used standard tools like spreadsheets and manual chart software to create graphs throughout history. The tools maintain their functionality. However, AI graph maker have introduced a new method for data visualization which has transformed our data presenting methods.
Traditional tools require multiple steps:
This process can take a lot of time.
If you are working under deadlines, an AI graph maker like QuickGraph AI can create charts in seconds. You simply upload your data or type a prompt, and the tool generates the graph automatically.
If speed matters → choose AI.
Many people struggle with choosing the correct chart type.
Should it be:
Using the wrong graph can confuse your audience.
An AI graph maker studies your data pattern and suggests the best visualization automatically. This removes guesswork and improves clarity.
If you feel confused about chart selection → choose AI.
Manual graph creation often leads to:
Even small mistakes can change the meaning of your data.
AI tools reduce these risks because they analyze and organize data automatically before generating the graph.
If accuracy is important → choose AI.
Traditional tools sometimes create basic or outdated designs unless you manually customize everything.
AI graph makers create clean, modern, and visually appealing charts instantly.
This is useful for:
If you want your reports to look premium → choose AI.
One powerful feature of AI tools is text-to-graph creation.
For example, you can type:
“Compare the monthly values for 2007, 2011, 2015, 2019, and 2023 using bars, while overlaying the Baseline as a line graph.”
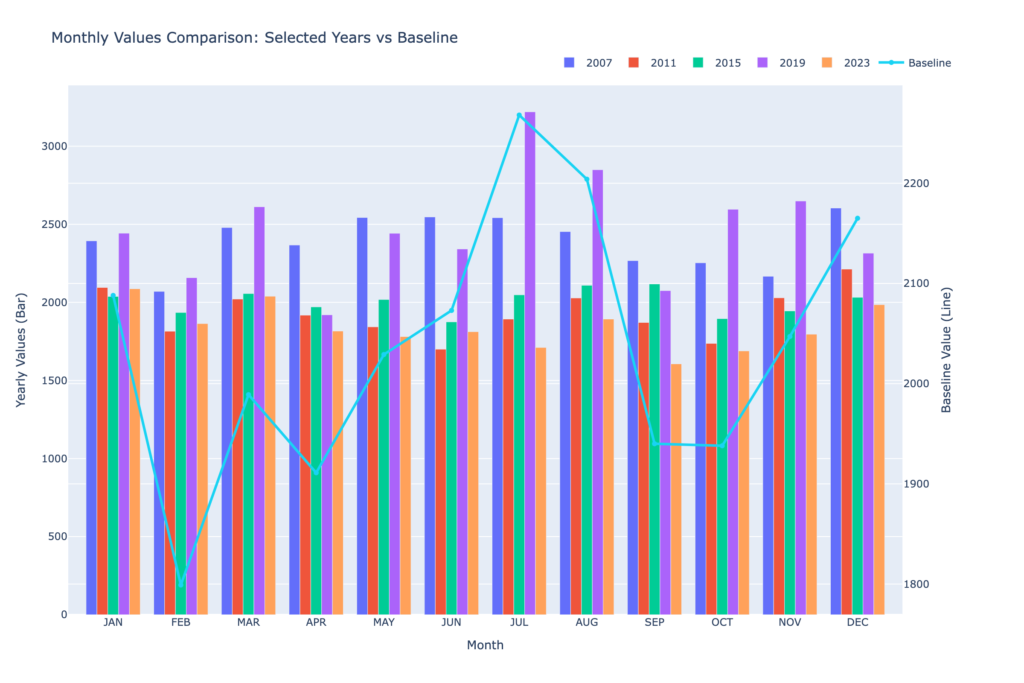
And the tool will generate the graph automatically.
Traditional tools cannot understand text instructions. You must manually create everything.
If you prefer simple text commands → choose AI.
Handling large datasets in traditional tools can feel overwhelming.
Sorting, filtering, and analyzing data manually takes effort.
AI graph makers help by:
This makes data analysis smarter and easier.
If your data is complex → choose AI.
Business owners, marketers, and analysts need fast reporting.
Using traditional tools repeatedly can slow down workflow.
AI tools like QuickGraph AI help teams:
If productivity matters → choose AI.
AI graph makers are powerful, but traditional tools are still useful in some cases:
If your needs are very basic and you enjoy manual control, traditional tools may still work.
AI Graph Maker vs Traditional Tools: Quick Comparison
| Feature | AI Graph Maker | Traditional Tools |
| Speed | Very fast | Slower |
| Chart Suggestions | Automatic | Manual selection |
| Error Reduction | High | Depends on user |
| Design Quality | Modern & clean | Basic unless customized |
| Ease of Use | Beginner-friendly | Requires knowledge |
AI focuses on automation and smart decisions.
Traditional tools depend fully on user skills.
Companies today want:
AI graph makers help businesses stay competitive. Instead of spending hours creating charts, teams can focus on analyzing results and planning growth.
Tools like QuickGraph AI are designed to make data visualization simple for everyone not just experts.
You should use an AI graph maker instead of traditional tools when:
Traditional tools are not outdated, but AI makes the process smarter and faster.
In today’s fast-moving world, smart tools give you an advantage.
If you want better graphs, better insights, and better results switching to an AI graph maker like QuickGraph AI is a smart move.