
March 24, 2026
The current data-driven world presents analysts with excessive data which exceeds their ability to manage it. The real challenge of...

The current data-driven world presents analysts with excessive data which exceeds their ability to manage it. The real challenge of...

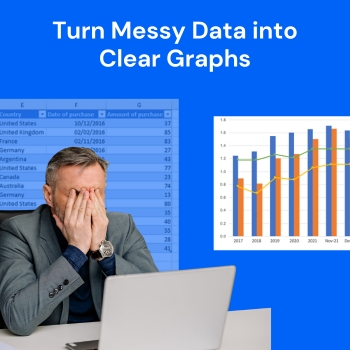
Most people don’t struggle with collecting data. They struggle with explaining it. You might have a spreadsheet full of useful...

The ability to manage data through spreadsheets breaks down when users attempt to handle increasingly complex and larger datasets. Endless...
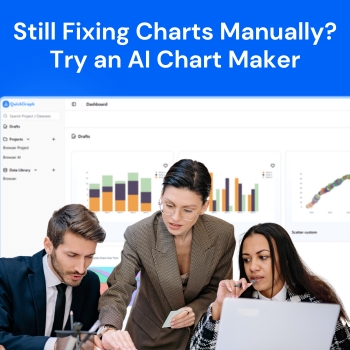
Charts serve as the most effective method to showcase data in a straightforward manner. The system creates visual representations which allow users...
Data plays an important role in modern decision-making. Numerical data serves as a performance measurement tool which businesses, students, researchers,...

Graph creation stands as an essential data analysis task. Graphs serve as effective tools for presenting numerical data in business...

In today’s digital world, data is everywhere. Businesses track sales, marketers measure campaigns, teachers analyse results, and students study trends. But raw...

The AI Chart Maker create faster and simpler data visualization functions than any previous method. The system creates professional charts within seconds...

An AI chart maker is a smart data visualization tool that uses artificial intelligence to convert raw data into clear, accurate charts...