
January 13, 2026
Data visualization is one of the most effective ways to understand and present information. Whether you’re a student, business analyst,...

Data visualization is one of the most effective ways to understand and present information. Whether you’re a student, business analyst,...
The process of data visualization has transcended graphical representation of numerals it is now uncovering valuable information and facilitating the consumption of...

Raw data alone doesn’t impress clarity does. Students struggle to turn spreadsheets into meaningful charts, and professionals waste hours tweaking...
AI chart tool have changed how people turn raw data into clear, professional visuals. Instead of spending hours creating graphs...

Spreadsheets are efficient at storing information but ineffective at communicating meaning. Large datasets hide patterns inside rows and columns, forcing...

Data plays a major role in decision-making across businesses, education, and marketing. However, raw numbers alone can be confusing and...

In 2025, artificial intelligence is transforming how individuals and businesses handle data visualization. Creating charts manually using tools like Excel...

Creating data visuals should not be complex or time-consuming. Today, people across business, education, analytics, marketing, and research prefer AI...
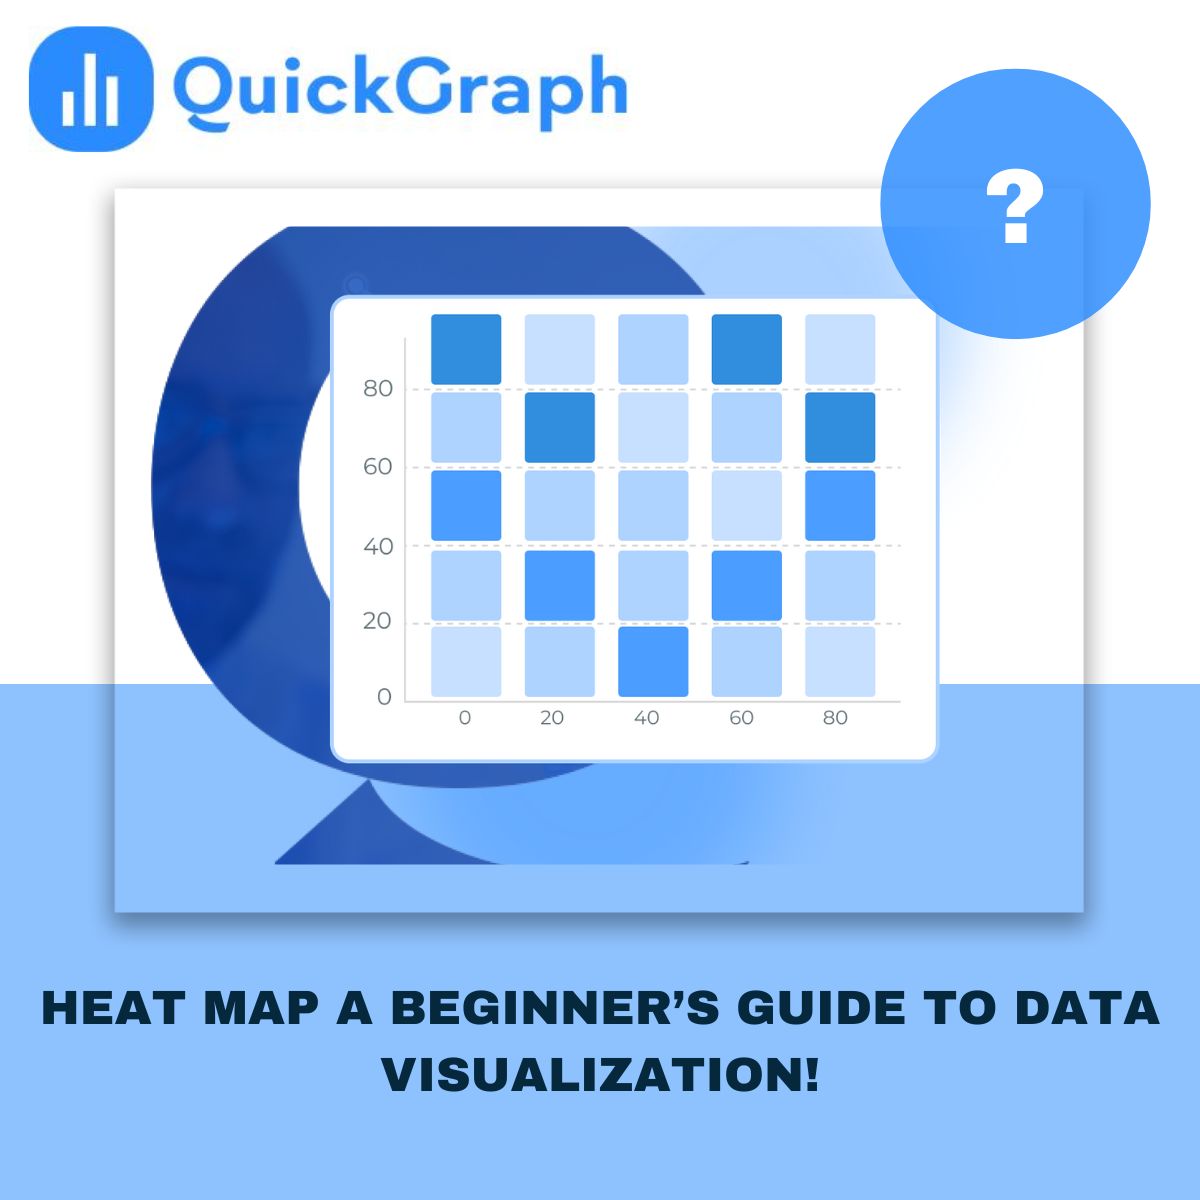
Creating maps online has never been easier. With a few clicks, you can turn data into colorful visuals that tell...