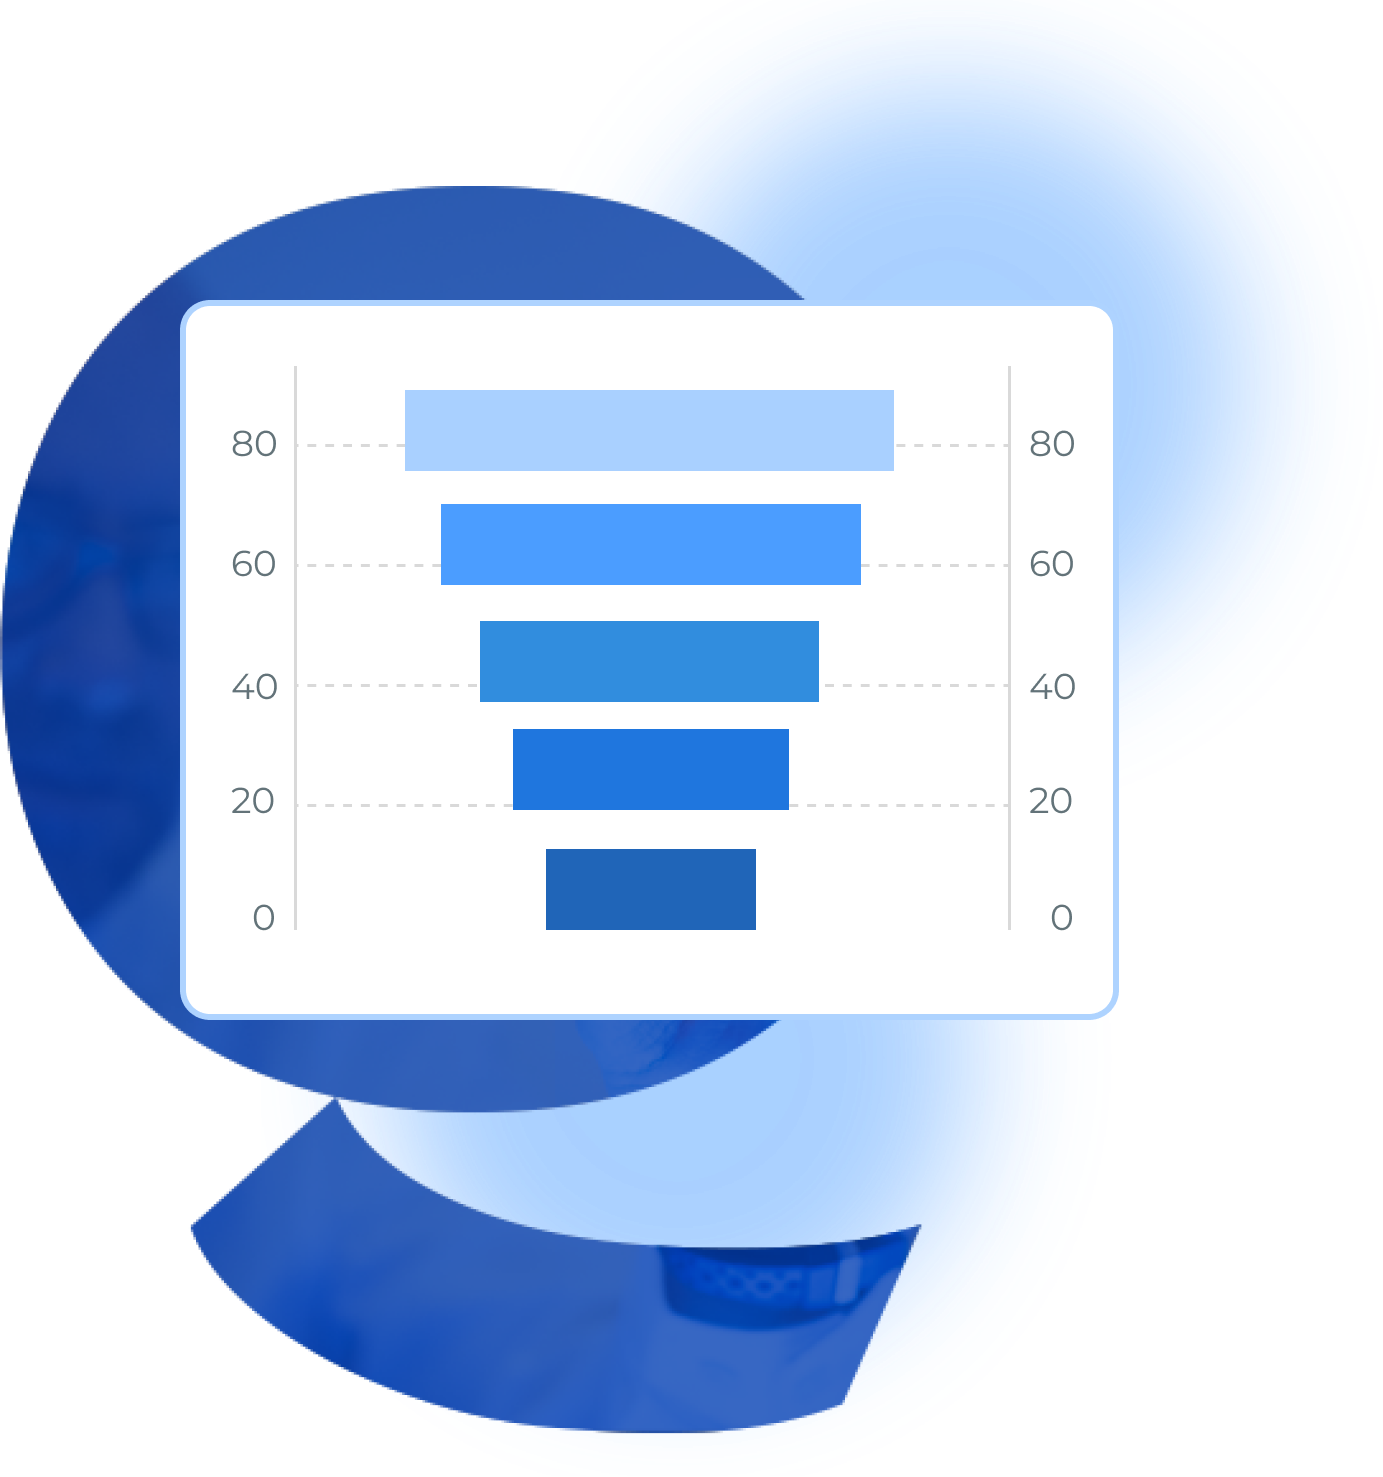

It gives clear visualization of a multi-step process, making the identification of the process easier as well as identifying potential bottlenecks.
A step-by-step guide for creating a Funnel Chart through QuickGraphAI Editor:
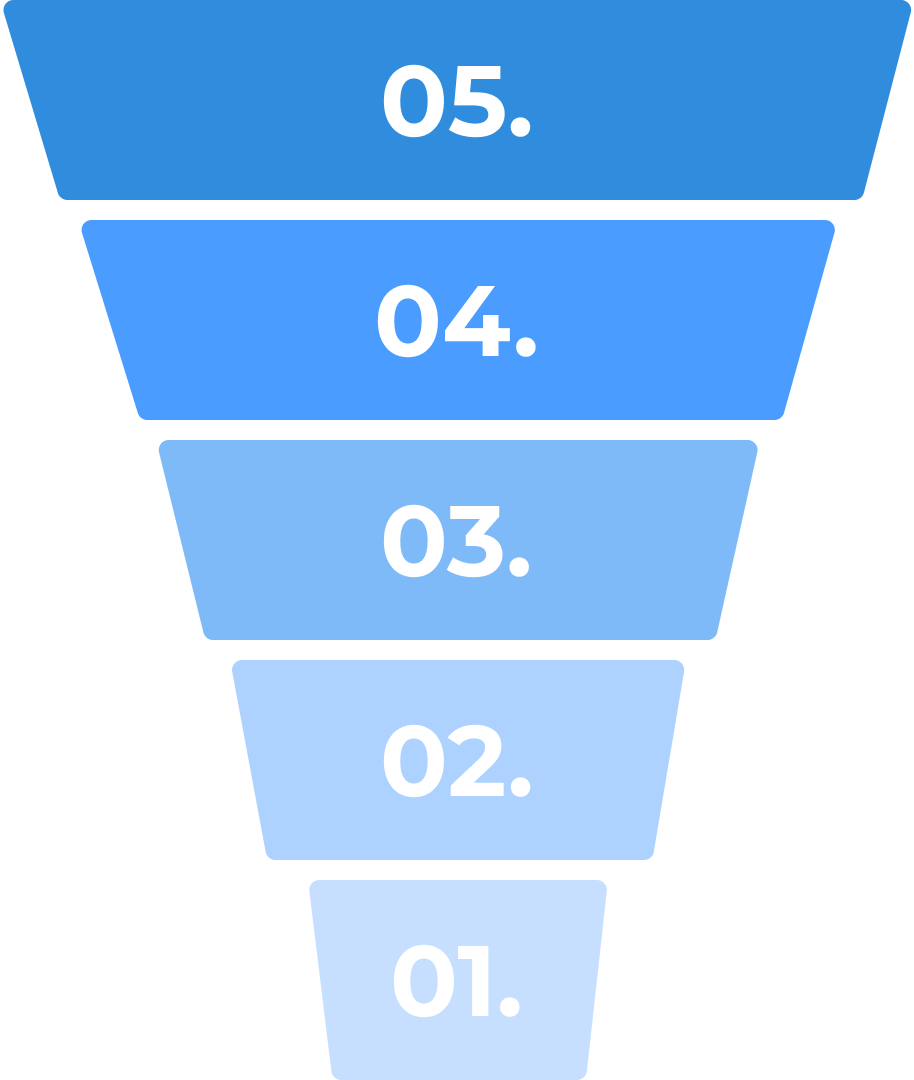
Though often used synonymously, a "funnel chart" usually refers to a graphic representation of a process or flow. A "funnel graph" is perhaps a catch-all term that may loosely apply to graphics purporting to represent data in the form of a funnel.
QuickGraph AI Editor transformed how we present data. The AI-powered insights and seamless interactive editor make complex visualizations effortless and dynamic. It was like having a data scientist and a designer in one tool!

Explore our insightful blog posts

All Rights Reserved. © 2026 by QuickGraph.