Create a Histogram in just a few clicks!

Histogram-QuickGraph

Let our histogram maker do the heavy lifting of tedious data visualization!

With our histogram maker, you can effortlessly create a Frequency Distribution Chart using our interactive histogram creator. Simply input your data, and our histogram graph creator will generate a dynamic Data Distribution Graph instantly. Whether you need a Bar Histogram, Statistical Histogram, or Density Plot, we ensure precise and clear visual representation.
Our online histogram generator lets you make a Binned Data Chart or Probability Histogram for free in just a few clicks. If you need a Column Histogram or a Distribution Bar Graph, our platform supports various histogram types, including an Interactive Histogram Chart and Multi-Series Histogram for deeper data analysis.
Experience the power of data visualization with our interactive histogram generator online. Unlock patterns and insights effortlessly.
Sign up now and start creating with our dynamic free histogram generator!
Key Features Of Histogram

Key Features Of Histogram

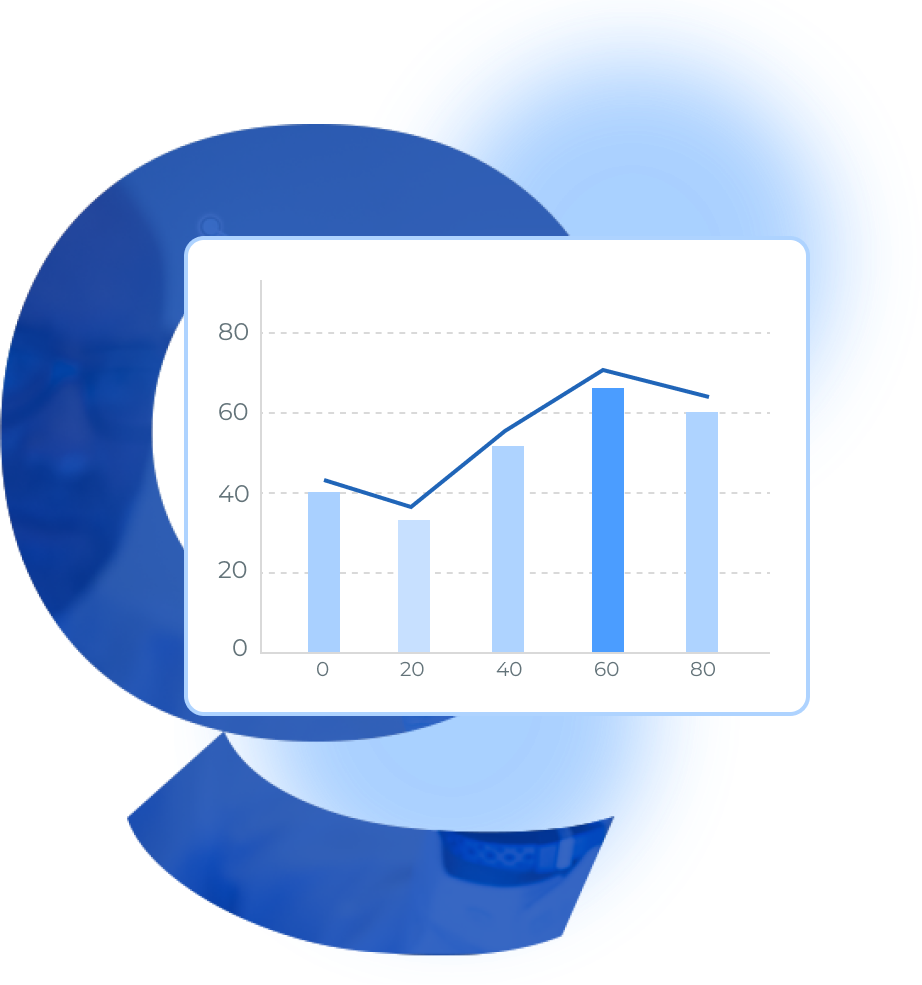
Histogram is a powerful tool to visualize the distribution of data. They vividly portray the frequency of data points within given intervals.

Data bins or intervals allow easy detection of data patterns and trends. The width of the bin highly influences the appearance of the histogram.
The height of a bar in a histogram represents the frequency, or sometimes relative frequency, of data points belonging to that particular bin.
Histograms usually do not have gaps between the bars. They are not like bar graphs because the data here is in a continuous form.
Histograms are very informative for understanding whether the data distribution is symmetric or skewed, or even multiple modalities.
Histograms are central to most statistical analyses. They are utilized in exploratory data analysis, hypothesis testing, and interpretation of data.

Interactive Histogram Graph Creator

Transform your data into clear, insightful dynamic histograms with QuickGraph AI.

Process of Making a Histogram

A step-by-step guide for creating a Bar Graph through QuickGraphAI Editor:

01

Create a New Project

Login into QuickGraphAI Editor website and if you do not have an account, sign up for one. After signing up and entering all your details; you then click on your own welcome page and tap on "Create New Project."

02

Select Graph Type

In the new user interface for creating a project, select "Histogram" as the graph type you wish to create.

03

Upload Your Data

Upload the dataset you want to visualize. QuickGraphAI supports various data formats, so ensure your data is in a compatible format.

04

Customize Your Histogram

Use the editor to customize your histogram. You can adjust the bin size, labels, colors, and other visual elements to suit your needs.

05

Save and Share

Once you're satisfied with the customization, generate the histogram. You can then save, download, and share your histogram for reports or presentations.

easy histogram maker

Significance of Histogram

free online histogram maker

Frequently Asked Questions

Histogram is a representation of graphs where numerical data shows the distribution of the continuous data. When the number of observations is large and the bin or interval size is small, then the resulting histogram will resemble a density distribution chart.

  • Find the range of the numerical data Range = Max - Min.
  • Determine the number of bins you want to use to present the data.
  • Determine the size of the bins: Bin size = Range/number of bins.
  • For every bin, count how many observations fall into it.
  • Plot the data as a column chart where every column represents the number of observations in a bin.
Creating a histogram with our histogram maker is a very great way of showing the data. Although you can compute many measures such as minimum, maximum, average, median, mode, and standard deviation, a histogram always gives you a clearer insight into the data distribution.

There has been scepticism between histograms and bar graphs but in reality, there is a huge difference between the two charts.

Histogram is used to plot continuous data where the intervals in it or bars represent the ranges. On the other hand, a bar graph is plotting the categorical variables.

  • Random Histograms, 
  • Uniform Histograms, 
  • Left & Right Skewed Histograms,
  • Multimodal Histograms,
  • Symmetric Histograms, 
  • probability histograms, 
  • and bimodal histograms.
line-graph-icons
line-graph-icon

Free Dynamic Histogram Generator

Make an Interactive Histogram Online Free without any hassle