Design and create pie chart online effortlessly.

Effortlessly transform your data into Interactive circular graph and pie chart

Whether you’re a seasoned data analyst or a curious beginner, you can create pie chart online with QuickGraph AI. Our free pie graph maker creates dynamic pie chart within seconds. No design skills are required!
Our interactive free pie chart creator offers a plethora of options to tailor your charts to your unique needs. Experiment with different chart styles, add information and export your creations in high-resolution formats for dynamic integration into presentations, reports, and more.
Discover the power of visual communication with our interactive free pie graph maker and unlock the dynamic world of data-driven insights.
Key Features Of Pie Chart

Key Features Of Pie Chart

Circular graphs / charts, such as pie charts, excel at visually depicting how different categories and their proportions contribute to a whole.

Pie charts are best suited for data that can be divided into categories. This could include anything from market shares to budget allocations.

The circular format of a pie chart is instantly recognizable. This makes it seamless and easy for viewers to grasp the overall picture quickly.

By visually comparing the sizes of different slices, viewers can easily identify the largest and smallest categories, facilitating quick analysis.

Pie charts naturally emphasize the percentage contribution of each category and slice to the whole, rather than absolute values.

Pie charts are comprehensively understood. This makes them a wide and dynamic tool for communicating data across various range audiences.

Pie Chart Generator Free

Generate Dynamic pie chart for free, anytime with QuickGraph AI

Process of Making a Pie Chart

Here’s a step-by-step guide for creating a Pie Chart with QuickGraphAI Editor.
create your own pie graph

01

line

Collect Data

Gather the data you want to visualize. Ensure it’s organized in a tabular format, with categories and corresponding values. Access the QuickGraphAI Editor and explore the portal.

02

line

Input Data

Enter your data into the editor. This usually involves copying and pasting your data into a spreadsheet format within the tool or uploading a CSV file.

03

line

Select Chart Type

Choose the pie chart option from the chart types available in QuickGraphAI Editor. This will create a Circle Graph with your data.

04

line

Customize the Chart

Adjust the chart settings to fit your needs. This can include:
Colors: Differentiate between data segments.
Labels: Add titles, category labels, and data labels.
Legend: Include a legend to explain the data segments.

05

Analyze and Interpret

Once your pie chart is created, analyze the visualized data to draw insights. Look for the proportion of each category and how they compare to each other.

Significance of Pie Chart

free online pie chart maker

Frequently Asked Questions

A pie chart, also known as a divided circle chart, is a circular graph divided into slices that represent the relative size of each portion within a whole. It is often used to display different categories, where each slice represents a category, and the entire pie corresponds to 100% of the whole.

Pie charts are used to demonstrate parts-to-whole with categorical or nominal data. Pie charts should not be used to demonstrate continuous data. A common mistake when selecting a pie chart is using data that doesn't work for a parts-to-whole comparison. This most often occurs when values are reported as percentages or proportions, but do not total up to a whole.

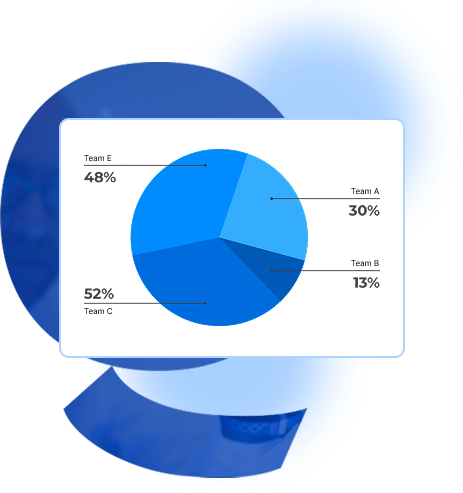
A pie chart is somewhat similar to a donut chart, it is useful for demonstrating how things are divided. If you have a budget and you want to show how much of it goes to each department, you can use a pie chart. Similarly, if you want to show how many people out of a group have specific characteristics, they work as well.

Sharing and printing your final chart is easy with QuickGraph AI. Download your visual in your file format of choice to print as a JPG, PNG, or PDF file. You can also share your graphic directly on social media channels or upload it to your website free of charge.

You can use our pie chart generator to make pie charts for presentations or reports.

When using QuickGraph AI's graph maker, consider the following:

  • Select the right tool according to your needs, like QuickGraph AI to create nicely-designed graphs and charts.
  • Use correct values for data.
  • Keep your graphs simple.
  • Customize if needed. If you're using QuickGraph AI, you can pick the background, illustrations, icons, and other design elements all with one click and customize your graphs as per your likings.
analytics
pie-chart-icon

Pie Chart Graph Maker

Generate Interactive and Dynamic pie charts in minutes with QuickGraph AI.