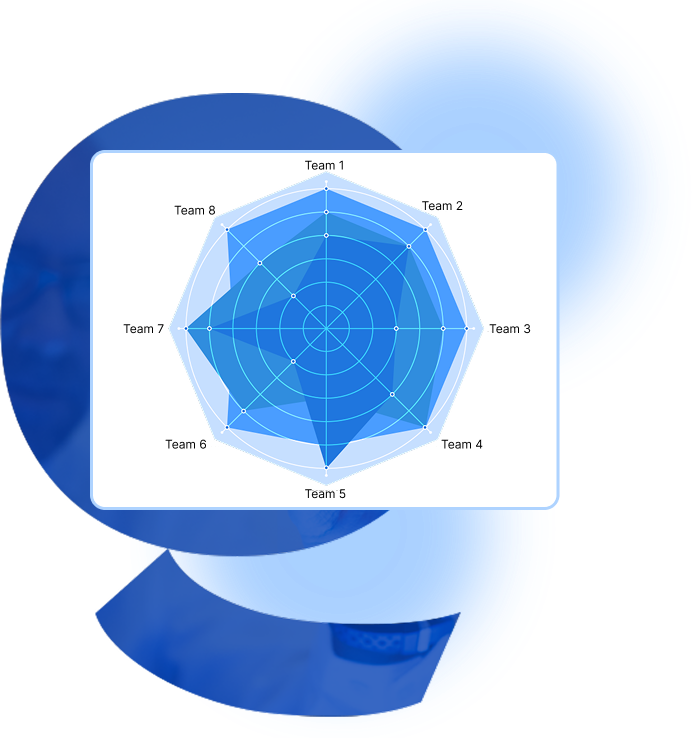
Interactive Radar Diagram Maker

Craft dynamic beautiful radar charts and spider plots with ease!

Introducing our user-friendly radar chart generator!

Our interactive radar chart maker is the perfect tool to turn your data into a fascinating, informative, and dynamic visualization. With our interactive interface, it’s effortless to create a dynamic spider chart, also known as a web chart, polar chart, or Kiviat diagram.
Unlock the power of visual storytelling with our interactive radar chart generator. Whether you need a multivariate data chart for comparisons, a comparative radar graph for performance tracking, or a skill assessment chart for evaluations, our tool makes it easy. You can even create a radar chart with multiple series to analyze complex datasets effectively.
Start Visualizing Your Data Today!
Key Features Of Radar Chart

Key Features Of Radar Chart

It excels at visualizing and comparing multiple variables or categories simultaneously. This makes them ideal for assessing performances.
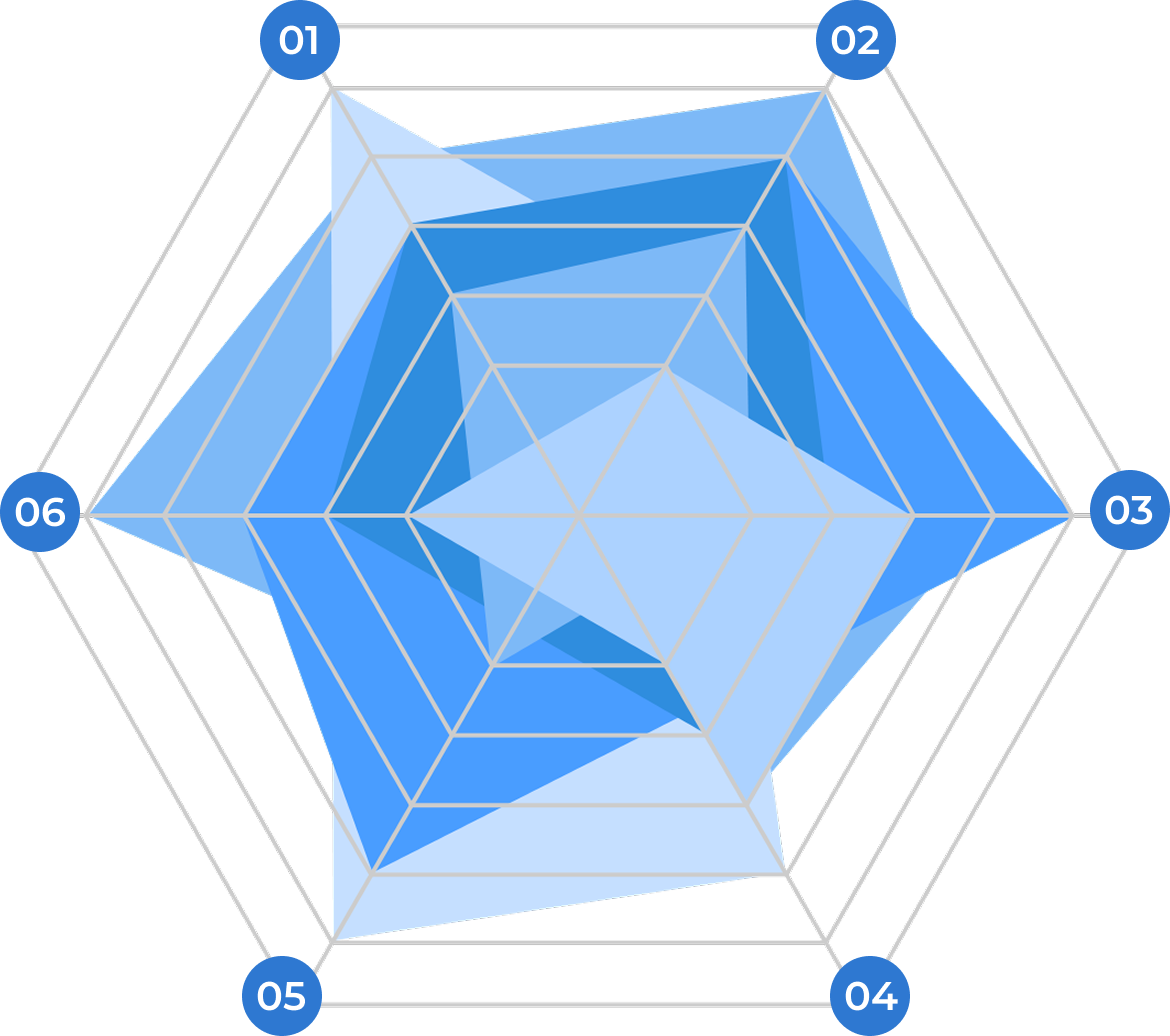
It efficiently display complex datasets in a small, visually appealing format. This is particularly useful when dealing when space is limited.
The unique, circular design of radar charts facilitates quick identification of trends, strengths, areas of overlap, and weaknesses in the data.
It offers flexibility in terms of color, design, etc. You can make the chart as per your requirements & provide flexibility for data visualization.
Its visually striking nature attracts attention and engages viewers. The circular design makes the data more interesting and memorable.
It is used to analyze wide range of anything from employee performance reviews to product comparisons to athlete profiles and a lot more.

Generate professional interactive spider charts and dynamic radar diagrams quickly.

Process of Making a Radar Chart

A step-by-step guide for creating a Radar Chart through QuickGraphAI Editor:
free radar chart

01

line

Sign up at QuickGraphAI

By following very basic steps, login into the QuickGraphAI Editor and click on creating an Interactive Radar Chart.

02

line

Input Your Data

Start by entering your data into the QuickGraphAI Editor. You can either manually input the data or upload a CSV file. This is the first step in using the radar chart generator.

03

line

Generate the Radar Chart

Once your data is ready, select the option to create a radar chart. The AI-driven tool will process your data and generate the radar graph automatically.

04

line

Customize the Chart

Using the customization options, you can change the colors, labels, and other features of your radar chart. This step enables you to make the radar diagram look appealing and tailored to your needs.

05

Save and Share

Once you customize the chart, you can download it as a PNG file or share it directly from the editor. This way, it becomes easier to share your spider chart with others.

Significance of Radar Chart

create radar chart online

Frequently Asked Questions

They're basically the same thing! 
Spider chart is a more casual term.
A radar chart is a more formal and widely used term.
A Spider radar chart is sometimes used to emphasize the connection.

Absolutely! Our radar chart maker is flexible. Even with a few data points, you can create a visually appealing and informative chart.
Yes! We offer various export options, including high-resolution images (PNG, JPG) and easily shareable links.
Absolutely! Our tool is user-friendly and doesn't require any coding or data science expertise.
Radar-Chart-icon
gold-trophy-icon

Our dynamic radar chart generator makes it easy to create interactive visuals.

Start now and make a spider chart that stands out!