Revamp Your Trading with QuickGraph AI's Candlestick AI!

As an Interactive AI candlestick chart tool, we offer a thorough suite of dynamic features to help you leverage and comprehend candlestick patterns for smarter trading decisions.

Create Candlestick Charts Free With QuickGraph AI!

With QuickGraph AI’s innovative candlestick AI technology, unlock the secrets of the market. Our dynamic AI candlestick chart tools empower traders to decode complex candlestick patterns and make informed decisions.
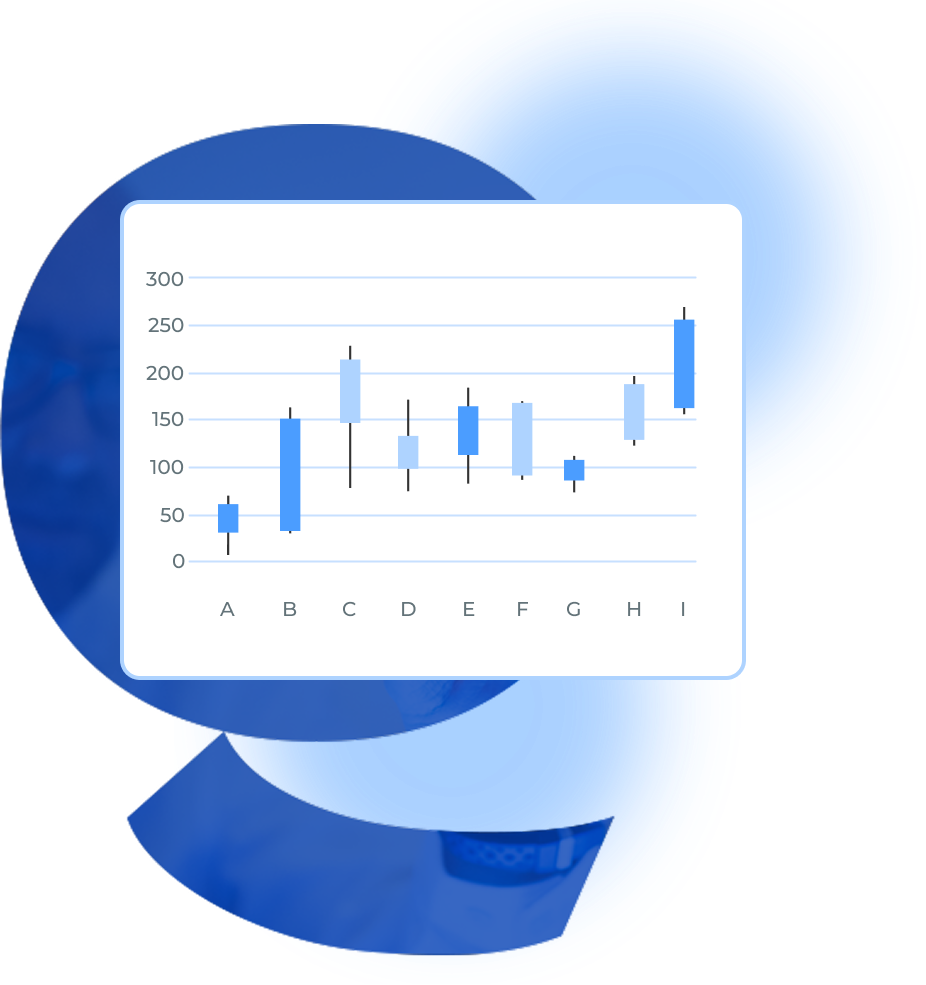
QuickGraph AI delivers precise Financial Market Candle Charts and identifies Bullish and Bearish Pattern Charts for better decision-making. Enhance your Stock Trend Visualization Chart capabilities and track emerging trends across various markets, including Cryptocurrency Candlestick Graph data, with ease.
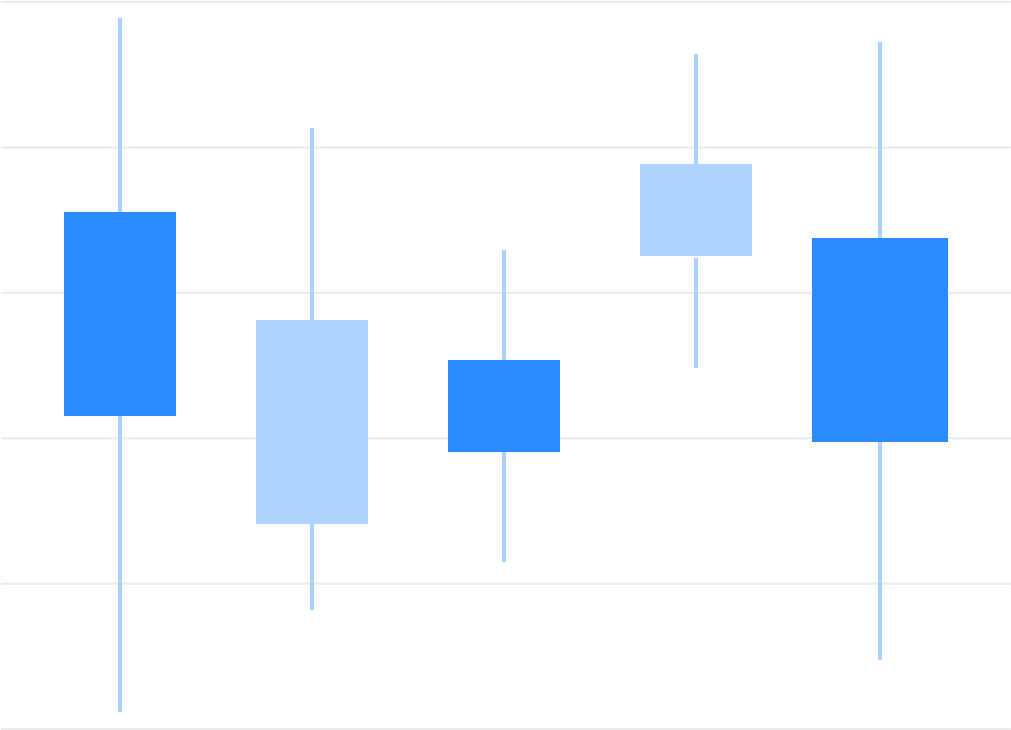
Even if you’re exploring hollow candlestick charts or delving into various types of candlesticks, QuickGraph AI offers a dynamic and interactive experience. Enjoy candlestick charts free of charge and benefit from the expertise of our dedicated candlestick makers.

Key Features Of Candlestick Chart

You can simply harness the strength of candlestick AI to gain better insights into market trends and make well-informed trading decisions via our Interactive Japanese Candlestick Chart and Stock Candlestick Graph.
You can explore a variety of AI candlestick chart types, including hollow candlestick charts and Trading Candle Charts, to suit your trading strategy and preferences. Our platform also supports Market Trend Candlestick views for deeper analysis.
You can stay one step ahead of the market with the Forex Candlestick Chart and other real-time charting options that provide up-to-the-minute information and analysis.
You can take advantage of our professional candlestick makers, guaranteeing precise and dependable charting instruments, including an Equity Trading Candlestick Graph tailored for accuracy.
You can scrutinize and decode diverse types of candlesticks and candlestick patterns, including those used in technical analysis candlestick charts, to enhance your trading approach across multiple markets.
You can enjoy an interactive and dynamic experience with our easy-to-navigate AI candlestick chart tools, designed for traders of all levels.

Navigate our Interactive Candlestick-Maker Effortlessly!

Engage with your data using our advanced AI candlestick chart features.

Process of Making a Candlestick Chart

A step-by-step guide for creating a Donut Chart through QuickGraphAI Editor:

01

line

Collect Data

Gather accurate financial data, including open, high, low, and close prices for a specific period. Ensure the data is complete and correctly formatted for precise visualization.

02

line

Choose a Time Frame

Decide the chart’s time interval, such as daily, weekly, or hourly, based on your analysis needs. Different time frames reveal unique trends and patterns in the data.

03

line

Structure the Candlestick

Each candlestick represents a period with a body (open to close) and wicks (high and low). A filled or hollow body indicates whether the price decreased or increased.

04

line

Set Colors for Candles

Use distinct colors (e.g., green for rising prices and red for falling prices) to identify trends easily. Consistent color coding improves chart readability and quick interpretation.

05

line

Plot the Candlesticks

Position each candlestick sequentially along the time axis to show price movements. Ensure spacing between candles reflects time intervals for clarity.

06

line

Add Axis Labels

Label the x-axis with time intervals and the y-axis with price levels. Clear axis labels help users understand the chart’s scale and data points.

07

line

Include Additional Indicators (Optional)

Enhance analysis by adding indicators like moving averages or volume bars. These provide deeper insights into market trends and potential reversals.

08

Interpret the Chart

Analyze patterns like doji, hammers, or engulfing candles to predict price movements. Recognize trends and reversal signals for informed decision-making.

Significance of Candlestick Chart

Frequently Asked Questions

A candlestick chart is a form of financial chart that is employed to graph the price action of an asset over a particular time. Each "candlestick" represents four main bits of information: the opening price, the closing price, the high, and the low.
QuickGraph AI utilizes worldly-wise algorithms to scrutinize and speculate market trends based on AI candlestick charts. This helps traders in taking informed decisions via insights into forthcoming price action.
Absolutely! QuickGraph AI offers diverse types of candlestick charts, such as the classic candlestick chart, the hollow candlestick chart, and many more. Each of them offers a well-defined visible indicator to allow traders to recognize trends in the market.
Candlestick patterns are unique structures formed by a single or multiple candlesticks that signal possible market directions. Identifying such patterns helps traders anticipate future price action and trade accordingly.
We follow rigorous data privacy policies. The team of candlestick-maker at QuickGraph AI ensures that your data is utilized only for improving your trading experience and is never distributed to third parties without your permission.
Donut-Chart-icon
line-graph-icons

Master the Market with our Interactive AI Candlestick Charts

Explore our candlestick chart features and elevate your trading strategy with QuickGraph AI today!