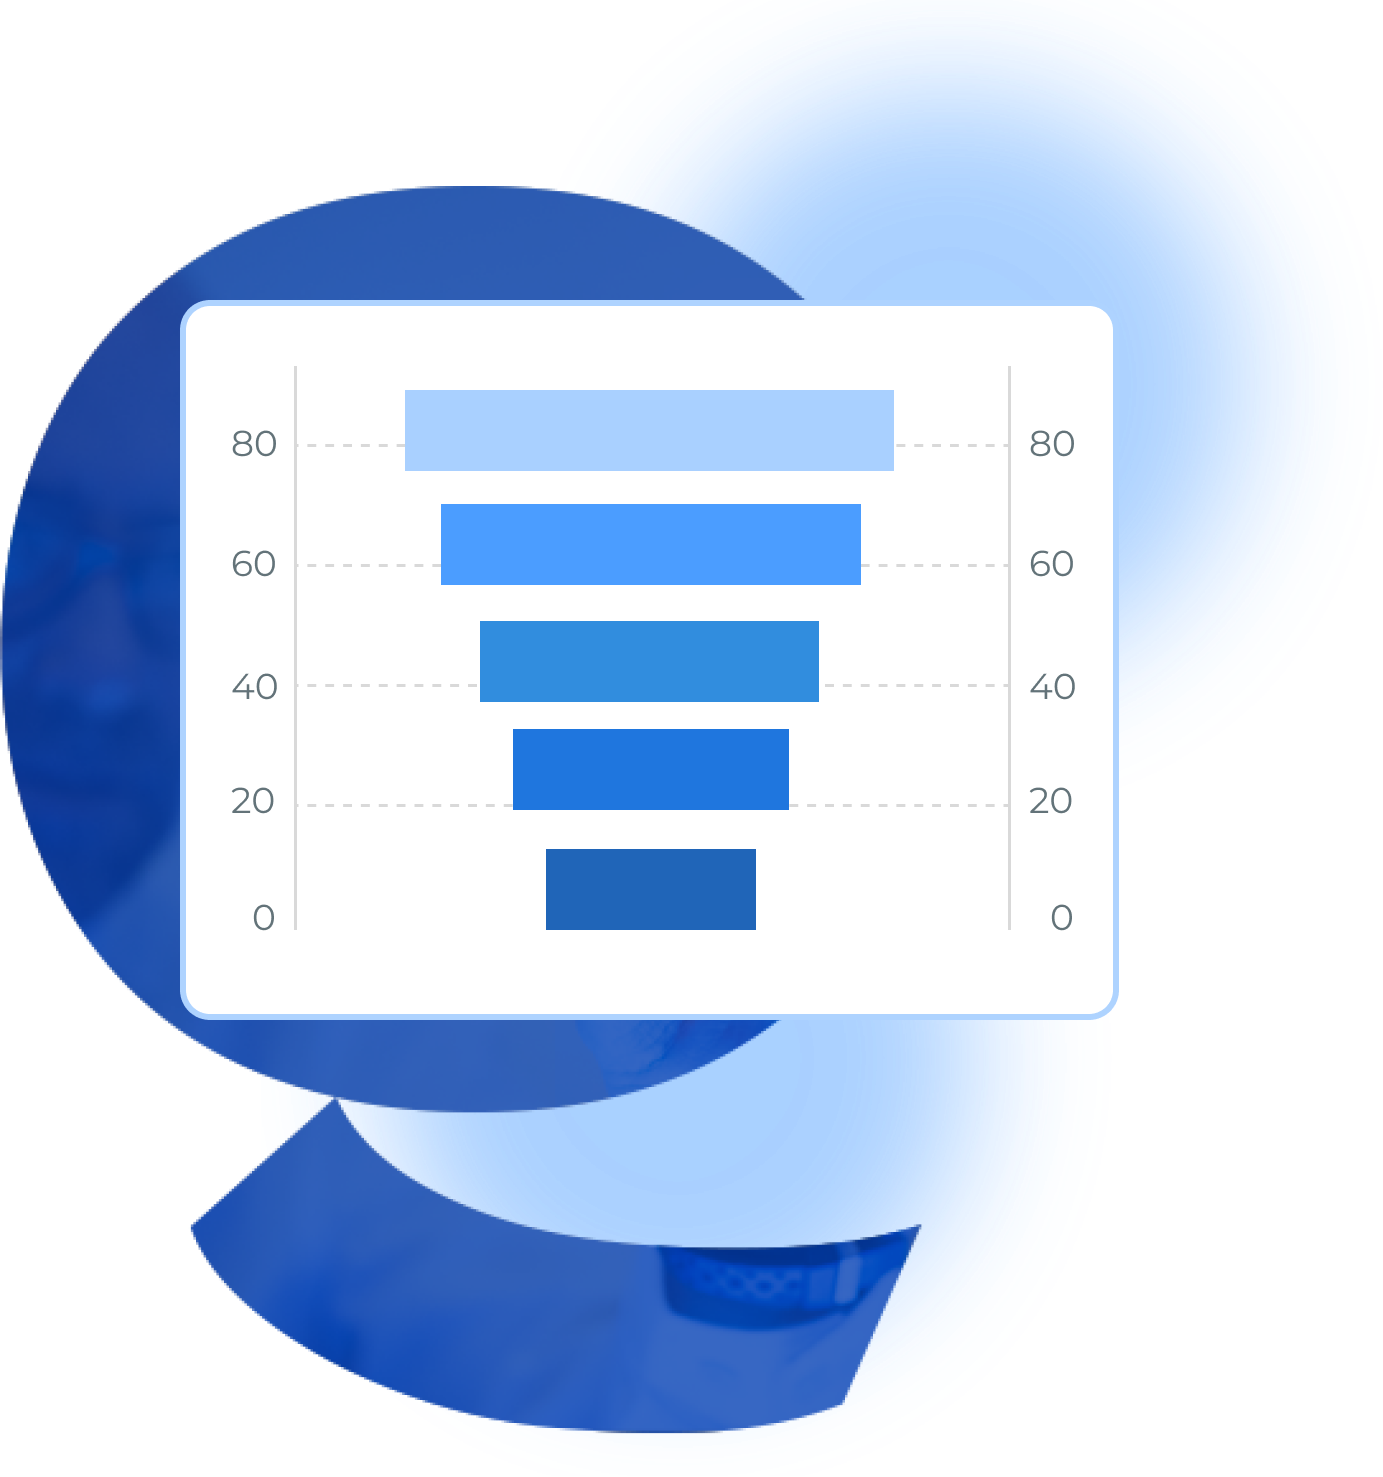
Design eye-catching interactive funnel graphics in minutes with our dynamic funnel chart creator!

Funnel-Chart-QuickGraph

Unlock the Power of Visual Storytelling with a Free Funnel Builder

Transform complex data into compelling insights with our interactive sales funnel chart maker. Whether you’re tracking sales performance or marketing campaigns, our dynamic tool helps you craft stunning conversion funnel diagram , Pipeline Chart etc in just minutes.
With us, you can create interactive marketing funnel visualization to analyze the Lead Conversion Funnel and optimize your process flow funnel for better efficiency. You can also track each stage of the customer journey funnel and identify drop-offs with a detailed funnel drop-off analysis chart.
Our user-friendly interface helps you design charts like hierarchical funnel chart, interactive funnel chart, multi-step funnel chart, and more effortlessly. You can add depth to your analysis with our funnel chart with percentages and enhance decision-making through dynamic funnel visualization.
Best of all? Our funnel builder is absolutely free!
So, start visualizing your data today with our dynamic free funnel chart creator!
Key Features Of Funnel Chart

Key Features Of Funnel Chart

It gives clear visualization of a multi-step process, making the identification of the process easier as well as identifying potential bottlenecks.

By visualizing the decrease in numbers at each stage of the funnel, one can readily identify the points at which leads are discontinuing their progression.
It enables you to compare different campaigns, channels, etc. This helps understand what's working well & what needs improvement.
You can gauge your progress as you work through the funnel's stages and continually adjust your targeting to achieve objectives.
It provides valuable customer behavior insights to help you make informed decisions about improving your processes.
It is an excellent communication tool for complicated information and leads to a shared understanding of the process.

Transform your data into interactive visuals with our dynamic funnel chart and funnel graph tools.

Process of Making a Funnel Chart

A step-by-step guide for creating a Funnel Chart through QuickGraphAI Editor:
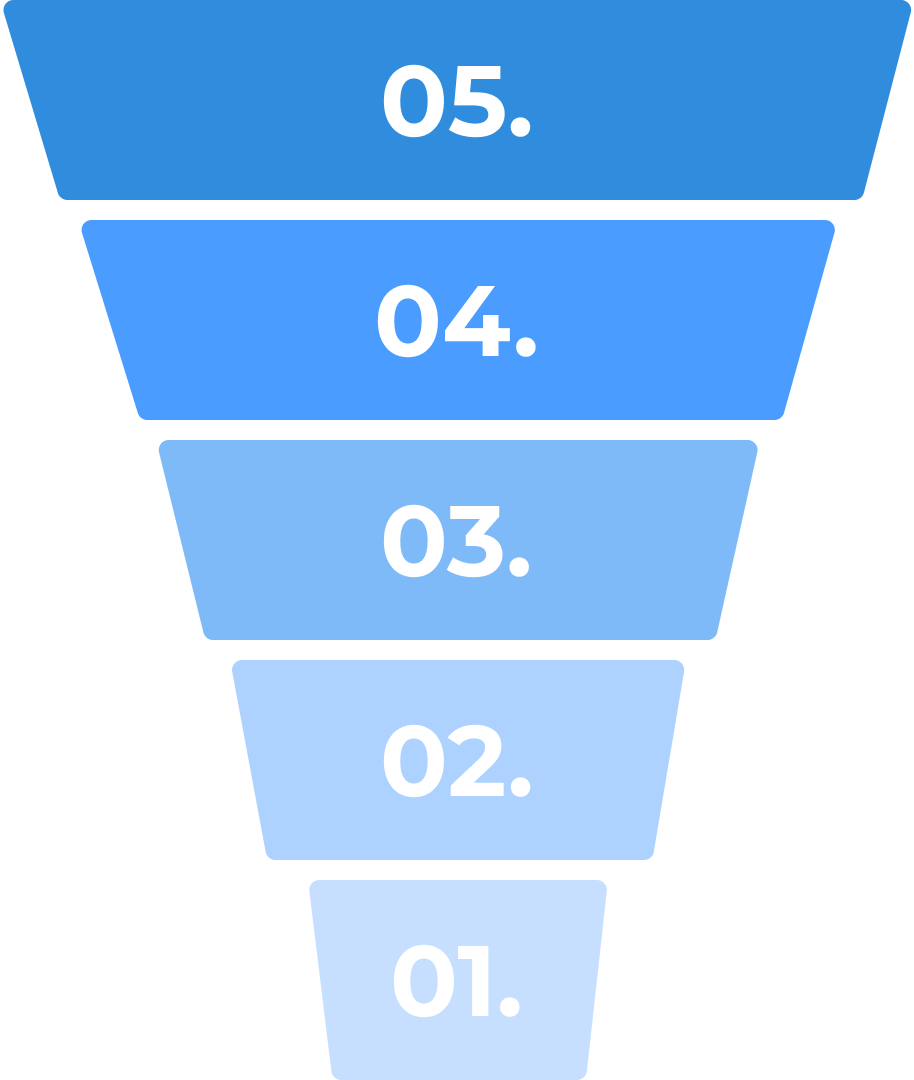
create a funnel chart

01

line

Sign up at QuickGraphAI Editor

Login or Sign up at QuickGraphAI Editor and look for a funnel chart creator. Start with Creating a New Project.

02

line

Import Your Data

Upload your data set. Ensure your data includes the stages of the process you want to visualize and the corresponding values for each stage.

03

line

Select Funnel Chart Option

Navigate to the chart options and select the funnel chart type. This might be listed under “funnel chart,” “funnel graph,” or similar terms.

04

line

Customize Your Chart

Use the customization tools to adjust the appearance of your funnel chart. You can change colors, labels, and other design elements to match your preferences.

05

Analyze and Save

Once your interactive funnel chart is ready, analyze the visual representation of your data. Save your chart for future use or share it directly with the editor.

Significance of Funnel Chart

funnel chart creator

Frequently Asked Questions

Though often used synonymously, a "funnel chart" usually refers to a graphic representation of a process or flow. A "funnel graph" is perhaps a catch-all term that may loosely apply to graphics purporting to represent data in the form of a funnel.
Yes, QuickGraph AI offers a free plan that allows you to create and explore basic funnel charts. This is a great way to experience the power and ease of use of our funnel chart creator before upgrading to a paid plan for advanced features.
Absolutely! QuickGraph AI is an ideal funnel graphic creator for marketers. You can easily visualize customer journeys, track conversions at each stage of the sales funnel, and identify areas for improvement. Our intuitive interface makes it simple to create professional-looking funnel charts that effectively communicate your marketing data.
QuickGraph AI offers support for data types ranging from website traffic statistics to sales volume, demographics about customers, etc. You can just import data using spreadsheets or databases and CRM applications.
Yes, QuickGraph AI offers a wide range of customization. You can change colors, fonts, labels, or else to make your funnel charts look aesthetically pleasing and insightful. You can also add annotations or callouts about some key insights you have, drawing attention to some specific areas of the funnel.
Absolutely! The QuickGraph AI is designed to be very user-friendly. Our drag-and-drop interface allows you to create stunning funnel charts without any design experience. You can get going quickly and start visualizing data in minutes.
Funnel-Chart-icon
creative-idea

Start building your perfect funnel today with our interactive tools.