
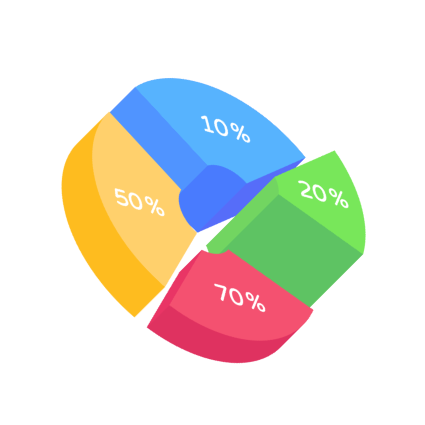
A step-by-step guide for creating a Donut Chart through QuickGraphAI Editor:
List all tasks required to complete your project. This will form the foundation of your Gantt chart and ensure no activity is missed.
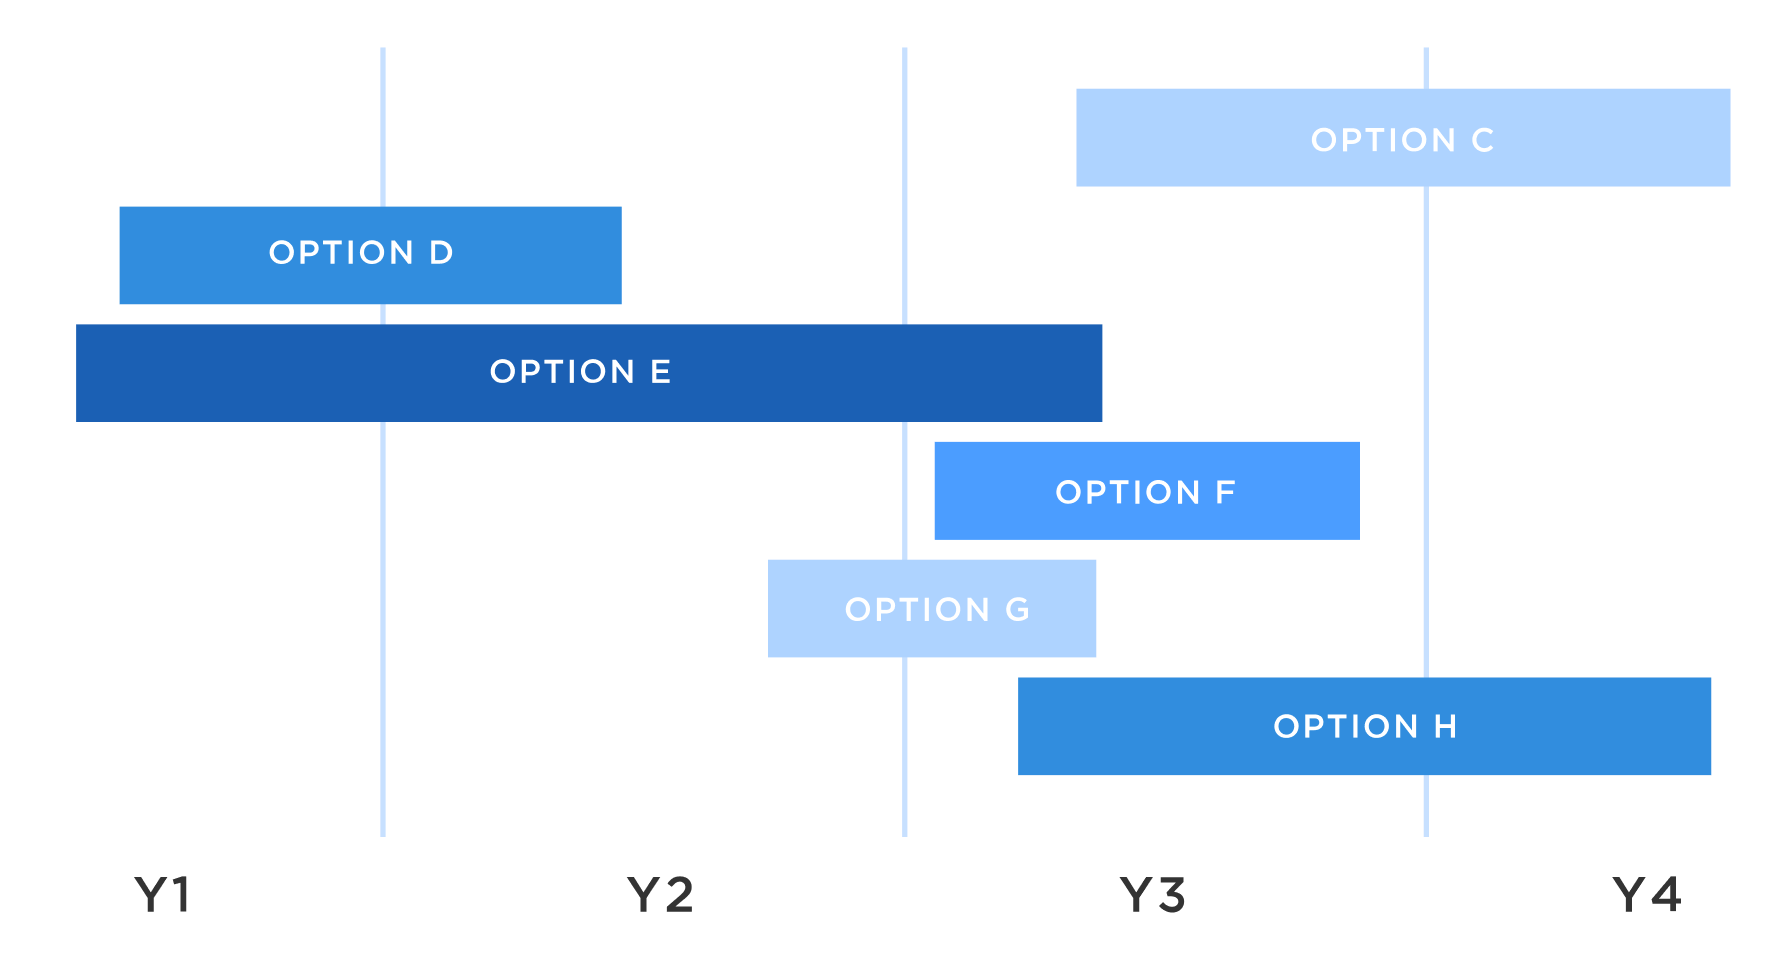
Identify key events or deliverables to mark project progress. A Milestone Chart is essential for tracking critical achievements.
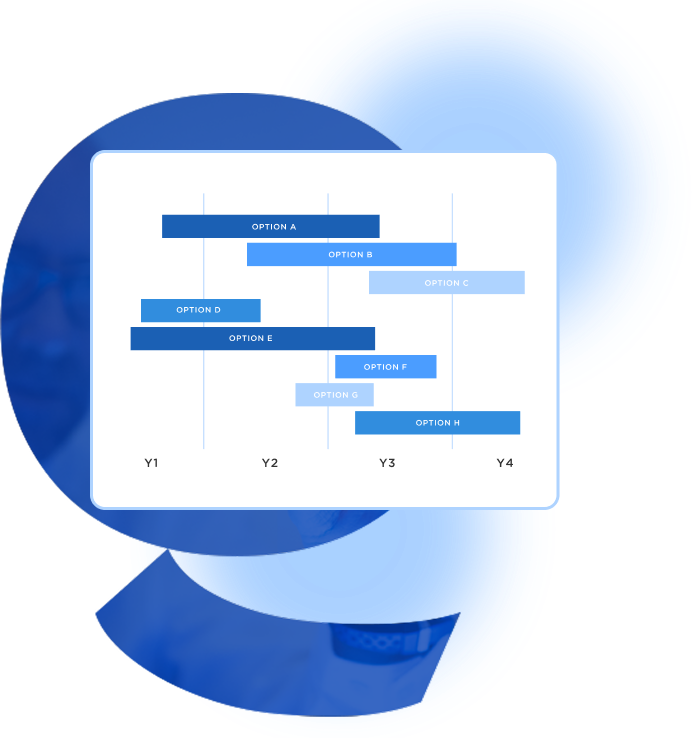
Enter task names, durations, and dependencies. An easy Gantt chart creator online ensures a smooth setup process.
Modify the chart as tasks progress. An AI Gantt chart generator helps maintain an updated Task Progress Chart effortlessly.

Some of the best practices are:
QuickGraph AI Editor transformed how we present data. The AI-powered insights and seamless interactive editor make complex visualizations effortless and dynamic. It was like having a data scientist and a designer in one tool!
Explore our insightful blog posts


All Rights Reserved. © 2026 by QuickGraph.