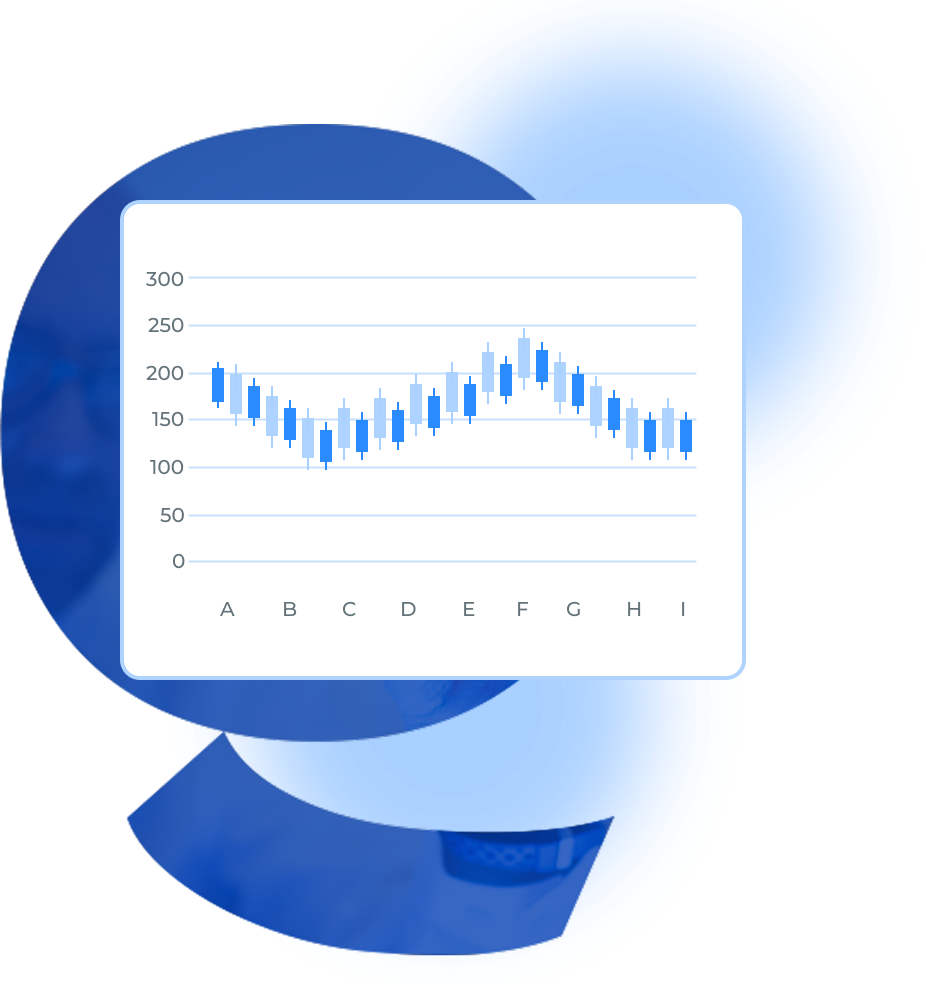
OHLC Chart and Graph is a powerful tool for traders and analysts just like you. With QuickGraph AI, you can discover what is the OHLC Chart and how our interactive OHLC Chart Generator and Maker transforms your data analysis.
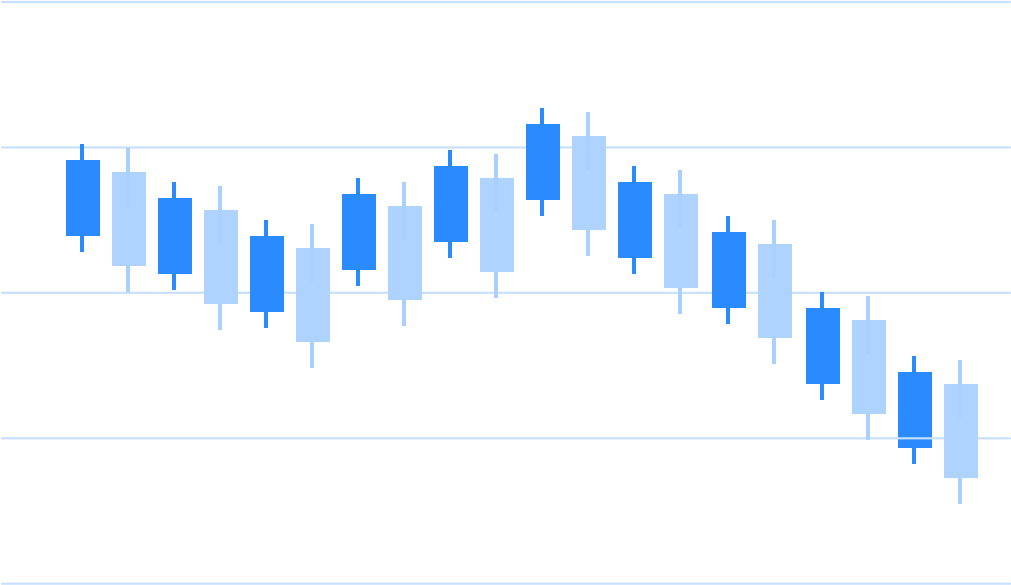
Even if you are merely exploring the complexities of the Open High Low Close Chart, keen to master the Open-High-Low-Close Chart, or working with a trading bar chart, we cater to you with the ultimate platform to visualize your financial data with ease and accuracy!
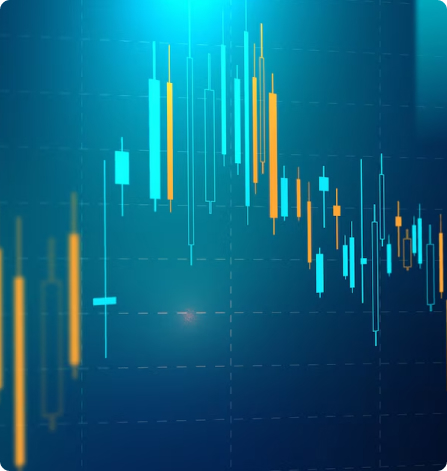
QuickGraph AI also supports various other chart types like the Technical Analysis Chart, Stock Price Chart, and Market Price Movement Chart, ensuring you capture every nuance of market behavior. From Commodity Price Chart to Equity Price Movement Chart, our comprehensive solutions are designed to help you stay ahead in the fast-paced world of trading.