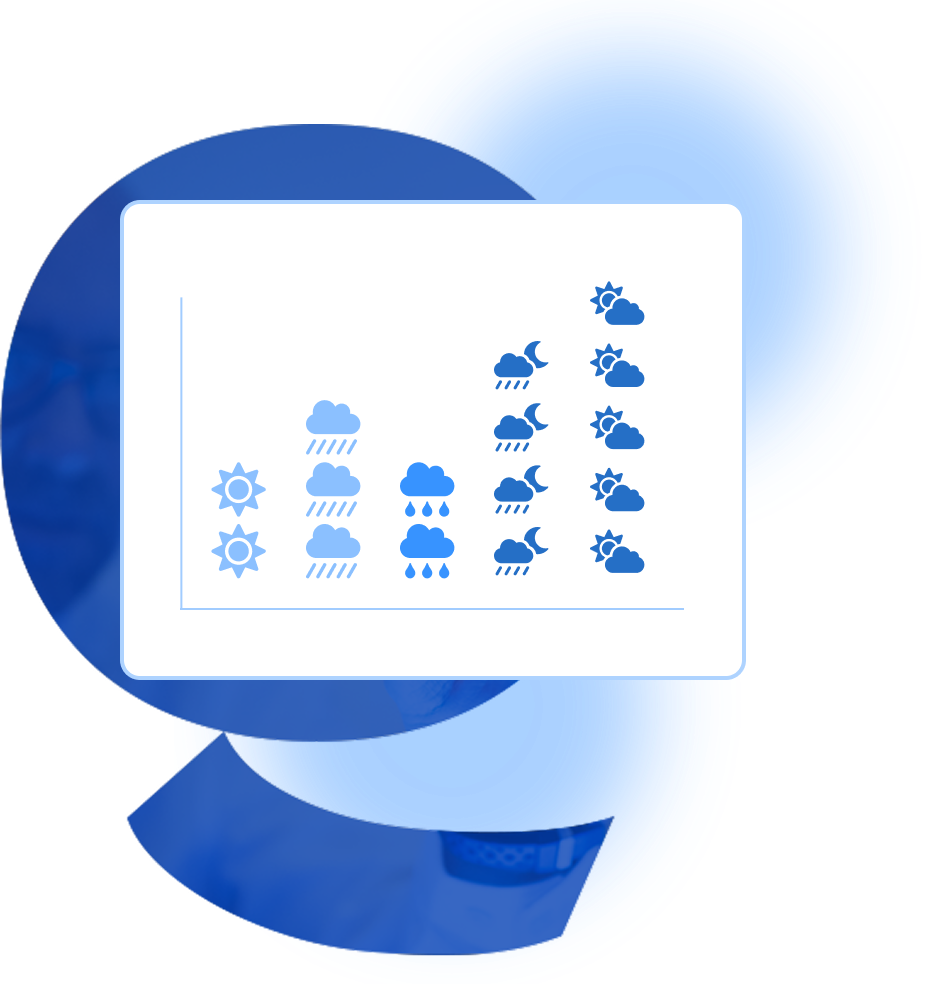
Best Pictogram Generator AI Free

Explore the world of pictogram charts and elevate your data visualization game. Create diagrams with icons that captivate your audience.

Create stunning Data Visualization with Icons Online.

QuickGraph AI offers an all-inclusive toolkit, including an interactive pictogram maker and pictogram generator AI, designed to transform your data into compelling visuals. Whether you need to create a dynamic pictograph chart, pictorial chart, or a graph with pictures, we’ve got you covered.
Customize your bar charts with unique symbols and shapes to craft a personalized Symbol Chart or Custom Icon Chart. Explore the world of Icon-Based Data Visualization and bring your data to life with an Interactive Pictogram Chart. Elevate your presentations with Infographic-Style Graphs, Visual Storytelling Charts, and dynamic Grid Pictogram Charts that captivate your audience. With our versatile tools, even an Emoji Chart becomes a fun and impactful way to visualize data.

Key Features Of Pictogram Chart

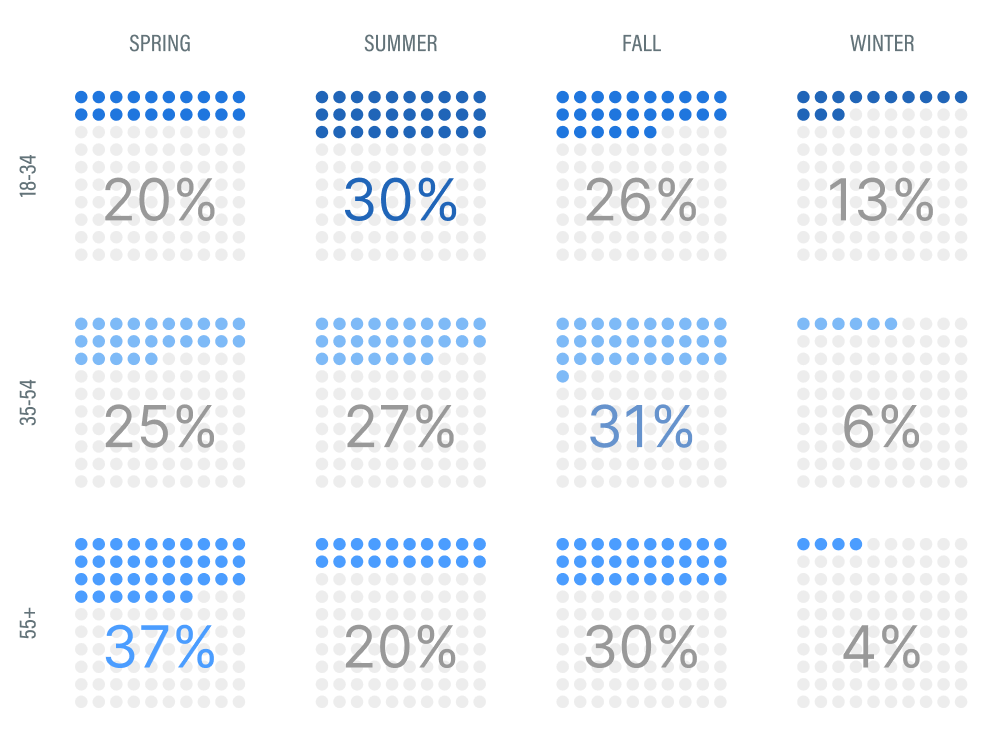
Pictogram charts, or pictorial charts, utilize symbols or icons to present data, and thus are very visual and understandable. This is particularly helpful for infographic charts and icon charts.
These charts are able to make complicated data simple by employing pictures or unique shapes in bar graphs so that information can be quickly understood by viewers. This is a standard data visualization with icon technique.
Pictogram charts allow for customization, enabling users to place icons in charts or use custom shapes in bar charts. This flexibility helps in creating unique and tailored visualizations.
By using symbols in bar charts or diagrams with icons, pictogram charts make it easier to compare different data sets visually. This is particularly effective in graphical charts and icon-based charts.
Pictogram charts are easier to understand for a broader audience, even those who might not be able to understand regular charts. Pictures and symbols make the information more understandable and easier to read.
Modern pictogram makers and pictogram generator AI tools provide interactive features, allowing users to create and modify pictogram charts easily. These tools enhance the overall experience of creating and using pictogram charts.

Customize Interactive Pictogram Charts!

Customize your dynamic bar charts with icons and custom shapes. 
Explore our interactive pictogram maker now!

Process of Making a Pictogram Chart

A step-by-step guide for creating a Donut Chart through QuickGraphAI Editor:
01

line

Define the Data

Identify the dataset you want to represent and categorize it for easy visualization. Ensure the data is clear and relevant to your audience.

02

line

Select Icons

Choose icons or symbols that accurately represent your data categories. Use simple, recognizable icons for better comprehension.

03

line

Determine Scale

Decide how each icon represents a specific value (e.g., one icon equals 10 units). Maintain consistency in scaling for accuracy.

04

line

Design the Layout

Arrange icons systematically—either in rows, columns, or grids. Ensure the design enhances clarity and quick interpretation.

05

line

Add Labels and Legends

Include clear labels and a legend to explain the value of each icon. This helps viewers understand the chart at a glance.

06

line

Use Consistent Colors

Apply a consistent color scheme to differentiate categories or data groups. Avoid using too many colors to maintain clarity.

07

line

Review and Refine

Check for accuracy, clarity, and visual balance. Ensure the chart effectively communicates the intended message.

08

Export and Share

Save the pictogram chart in a suitable format (e.g., PNG, SVG) for presentations, reports, or online sharing.

Significance of Pictogram Chart

Frequently Asked Questions

Pictogram charts are graphical illustrations of data based on icons or symbols. You can create eye-catchy pictograph charts by utilizing a pictogram maker or pictogram generator AI.
Yes, you can! Pictogram charts enable you to apply custom shapes in bar charts to more accurately portray your data. This gives a personal and distinctive flavor to your pictorial charts.
To put icons in a chart, make sure that the icons are appropriate for the data they symbolize. Employ consistent spacing and sizing for a neat appearance. Most pictogram creators offer guidelines and tools to assist you in putting icons in charts correctly.
To design good infographic charts with pictogram charts, be simple and clear. Utilize easily understandable icons and neatly organize your data. You can design professional charts with the help of a good pictogram maker.
Pictogram charts are best suited for depicting categorical data, comparisons, and trends. They are suitable for data that can be readily linked with icons or symbols and hence are ideal for graphs with pictures and symbol-based charts.
Donut-Chart-icon
line-graph-icons

Elevate Your Data with Dynamic Pictogram Charts!

Turn your data into a diagram with icons. Explore our interactive pictogram generator AI today!