Best Sunburst Diagram Generator

Dive deep into your data with interactive sunburst charts and multi-level visualizations.

Enlighten Your Data with QuickGraphAI's Sunburst Charts

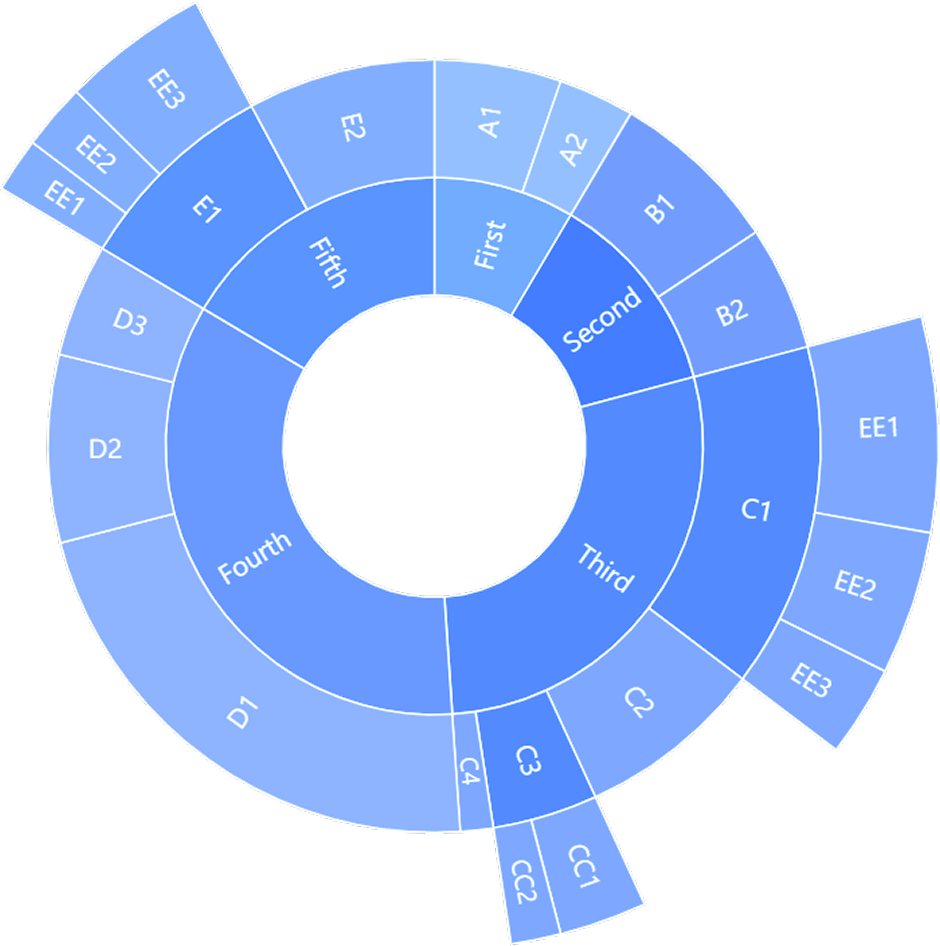
Visualize your data like never before with our dynamic sunburst chart and radial treemap. From crafting detailed sunburst diagrams to customizing radial treemap, our interactive tools empower you to present complex information effortlessly.
Using our simple-to-use tools, you can quickly insert a sunburst chart into your presentations or utilize our sunburst diagram generator to customize your visualizations to perfection.
Dive into data visualization with QuickGraphAI and see your data in a whole new light!

Key Features Of Sunburst Chart

Our dynamic sunburst charts enable you to see hierarchical data at multiple levels so that it is easy to comprehend complicated relationships. This multi-level data representation is also supported by other circular visualizations like the Concentric Circle Chart, Nested Donut Chart, and Layered Pie Chart.
Dive deeper into your data with interactive features. Click on any segment of the sunburst diagram to zoom in and explore detailed information. Similar functionalities are available in our Nested Circle Graph, allowing for dynamic data analysis.
Tailor your sunburst plot to match your brand or presentation style. Adjust colors, labels, and sizes to create the perfect visualization.
As a sunburst pie company, our charts help businesses make data-driven decisions by clearly displaying key metrics and trends.
Effortlessly insert a sunburst chart into your reports or presentations with our user-friendly tools, ensuring your data is always at your fingertips.
Use our sunburst diagram generator to create custom diagrams quickly and efficiently, saving you time and effort. With our advanced tools, you can also design other complex visualizations, including the Circular Proportional Chart and Multi-Level Data Representation models.

Get Started with QuickGraphAI Today!

Seamlessly integrate beautiful sunburst charts into your presentations.

Process of Making a Sunburst Chart

A step-by-step guide for creating a Donut Chart through QuickGraphAI Editor:

01

line

Data Collection and Preparation

Gather hierarchical data and organize it into a tree structure for visualization. Ensure data is cleaned and formatted for accurate representation.

02

line

Choosing the Right Chart Type

Select a suitable chart type such as a Radial Treemap, Circular Hierarchical Chart, or Hierarchical Sunburst Graph based on data complexity and visualization goals.

03

line

Structuring Hierarchical Data

Convert your dataset into a parent-child relationship to reflect nested categories in the Tree Structure Circular Chart format.

04

line

Selecting Visualization Tools

Use visualization libraries or software like D3.js, Plotly, or Tableau to design interactive Segmented Radial Charts and Nested Donut Charts.

05

line

Designing the Chart Layout

Create a clear and proportional layout using concentric circles to form a Concentric Circle Chart for better data segmentation.

06

line

Assigning Data to Layers

Map data levels to chart layers, forming a Layered Pie Chart or Nested Circle Graph to represent multi-level information.

07

line

Color Coding and Labels

Apply distinct colors and descriptive labels to each segment of the Multilevel Pie Chart for easier data interpretation.

08

line

Adding Interactive Features

Implement zooming, tooltips, and click events to make the Circular Proportional Chart interactive and user-friendly.

09

line

Testing and Refining

Validate the Nested Ring Chart for accuracy by testing it with real data and refining the visualization as needed.

10

Final Presentation

Ensure the Hierarchical Sunburst Graph is polished, well-labeled, and ready for presentation or public sharing.

Significance of Sunburst Chart

Frequently Asked Questions

Sunburst charts are a form of hierarchical data visualization where data is represented circularly. Each level of the hierarchy is depicted as a ring, with the innermost ring representing the root. As a type of Circular Hierarchical Chart, sunburst charts effectively illustrate part-to-whole relationships and hierarchical structures.
A sunburst chart / segmented radial chart, is unique in that it presents hierarchical data in a circular layout. This format makes it easy to visualize and interpret the relationships between different levels of information. Similar to a Multilevel Pie Chart, it reveals the hierarchy and proportion of each segment clearly—offering a more detailed perspective than conventional bar or pie charts.
It is easy to add a sunburst chart using QuickGraphAI! Simply upload your hierarchical data set, choose the sunburst chart option, and personalize the chart according to your requirements. Our user-friendly interface ensures that it is easy to create and update your sunburst charts.
Sunburst charts can assist companies in analyzing hierarchical data like organizational charts, product categories, or customer segments. They make it easy to visualize the data and identify trends, patterns, and areas that need improvement.
Getting started is easy! Sign up on our website, upload your hierarchical dataset, and use our sunburst chart tools to create stunning visualizations. Transform your data into insightful sunburst charts with QuickGraphAI today!
Donut-Chart-icon
line-graph-icons

Visualize Your Data Like Never Before with QuickGraphAI!

Transform complex data into clear and interactive sunburst plots.