

A step-by-step guide for creating a Donut Chart through QuickGraphAI Editor:
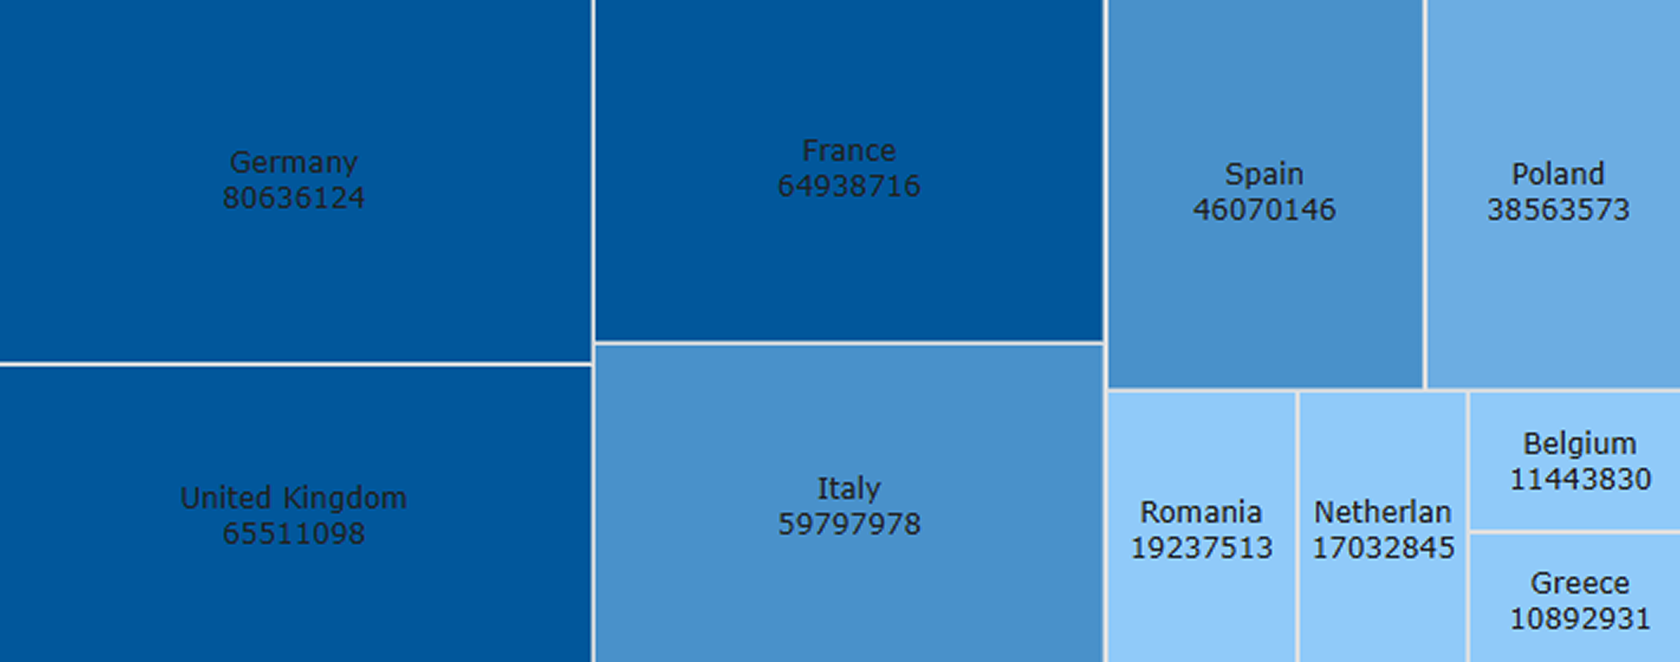
Gather hierarchical data and structure it into categories and subcategories to visualize relationships in a treemap chart effectively. Using our tree map AI tool can simplify data organization and ensure accurate representation.
Use the tree map AI tool to generate the final treemap graph, which can be shared or embedded for better data visualization and communication of hierarchical structures.

QuickGraph AI Editor transformed how we present data. The AI-powered insights and seamless interactive editor make complex visualizations effortless and dynamic. It was like having a data scientist and a designer in one tool!

Explore our insightful blog posts


All Rights Reserved. © 2026 by QuickGraph.