Creative Triangle Bar Chart Creator Online Free

Transform your data into interactive visuals with our Triangle Bar Chart Creator. Experience the elegance of Pyramid Bar Charts and Triangular Column Charts that offer a fresh, pyramid-style bar chart approach.

Create Custom and Modern Triangle Bar Charts Online Free.

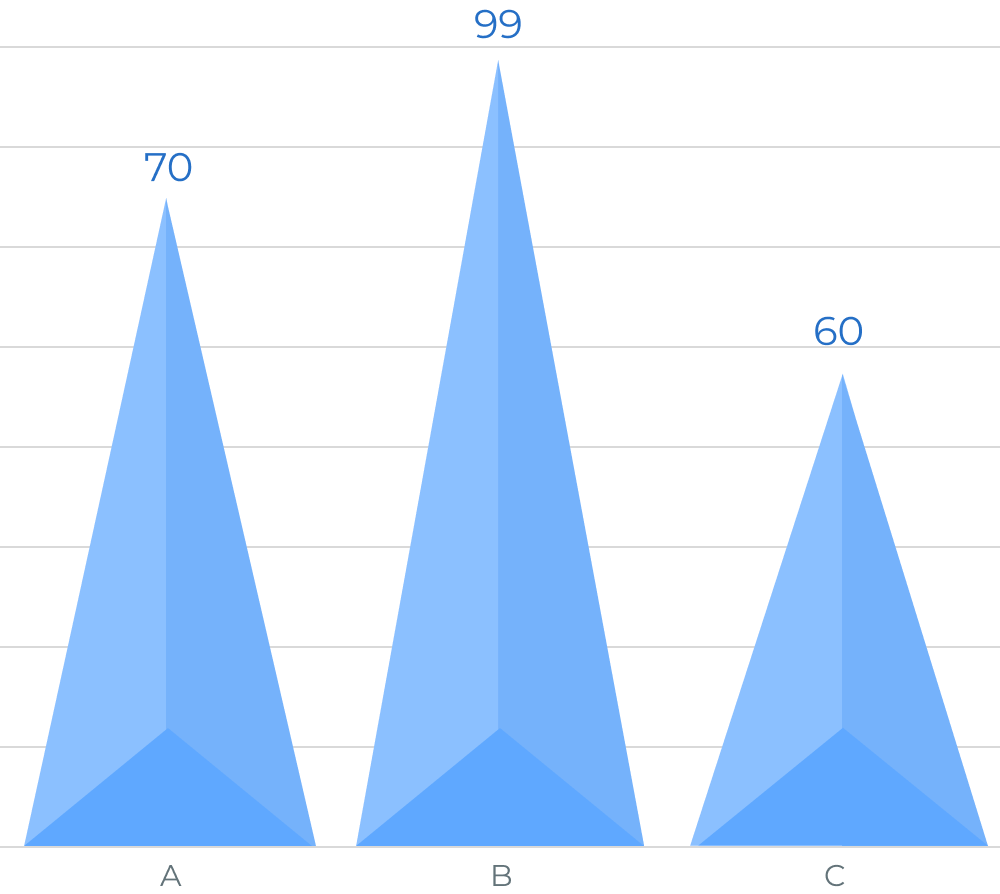
We are the Best Interactive Triangle Bar Chart Creator Online, offering a fresh perspective on data visualization with dynamic Pyramid Bar Chart and Triangular Column Chart.
Say goodbye to the mundane and embrace the pyramid-style bar chart as an alternative to traditional bar charts. Discover unique bar chart designs that are both interactive, dynamic, and functional. With our creative bar chart designs, you can create custom bar charts that reflect your brand’s identity and stay ahead with dynamic modern bar chart solutions.
Experience the future of data storytelling with our modern bar chart solutions tailored to meet your specific needs!
Visualize your Data Now!

Key Features Of Triangle Bar Chart

The triangle bar chart offers a unique and visually appealing alternative to traditional bar charts, making your data stand out.

Whether you need a Pyramid Bar Chart or a Triangular Column Chart, our triangle bar chart creator can handle various data visualization needs.

It is perfect for displaying hierarchical data, the pyramid-style bar chart helps in showcasing data layers effectively.

With creative bar chart designs, you can create custom bar charts that align with your brand's aesthetics and requirements.

It helps you stay ahead with modern bar chart solutions that bring a fresh look to your data presentations.

The triangular shape allows for better comparative analysis, making it easier to interpret complex data sets.

Create Stunning Bar Chart Designs Online

Elevate your presentations with custom bar charts tailored to your needs.

Process of Making a Triangle Bar Chart

A step-by-step guide for creating a Donut Chart through QuickGraphAI Editor:

01

line

Understand the Data

Identify and collect categorized data that can be represented visually, ensuring each category has a corresponding numerical value.

02

line

Design the Chart

Represent each data point using a triangle where the height corresponds to the value, ensuring proportional accuracy.

03

line

Create the Chart in Different Tools

Use your chosen platform to draw triangles, adjusting their dimensions to reflect the data accurately.

04

line

Customize the Chart

Enhance the chart by adding labels, colors, and annotations to improve clarity and visual appeal.

05

Interpret the Chart

Analyze the chart by comparing triangle heights, where taller triangles indicate larger data values.

Significance of Triangle Bar Chart

Frequently Asked Questions

A triangle bar chart is a special and aesthetically pleasing form of bar chart that utilizes a triangular structure to display data. It is an alternative to the traditional bar chart, presenting data in a new way.
It is quite simple to create a triangle bar chart using our triangle bar chart maker. With this feature, you are able to feed in your data and design to suit your purposes, whether a Pyramid Bar Chart or a Triangular Column Chart.
Yes! Our triangle bar chart maker is highly customizable. You can design bar charts that accurately represent your brand, allowing your data visualizations to be unique and businesslike.
Triangle bar charts are best used for hierarchical data and comparative comparisons. They are suitable for representing data layers and simplifying complicated data sets to make them more understandable. No matter if you require a Pyramid-type bar chart or a Triangular Column Chart, this layout is effective and versatile.
A triangle bar chart is a visually impactful and innovative method of data visualization. It is an alternative to conventional bar charts, which present data in a distinct manner that has the potential to make one pay attention and better understand.
Donut-Chart-icon
line-graph-icons

Visualize Your Data Like Never Before with QuickGraphAI!

Transform complex data into clear and interactive sunburst plots.