Discover Insights with our Interactive Waterfall Chart Maker!

Get started today and see how our dynamic waterfall chart maker can transform your data into actionable insights.

Create your first chart and explore the possibilities with QuickGraphAI!

Visualize Your Data Flow with Waterfall Charts

The waterfall chart is a stacked bar graph with an apparent and an absent series of bars. New or seasoned in the idea or needing to polish one’s skills, QuickGraphAI has it all to create interactive waterfall charts.
Plunge into the universe of waterfall charts, bridge charts, cascade charts, and stacked waterfall charts, and find out how these valuable tools can help turn your data into insights that count.
Join us on this adventure and release the complete potential of your data using our easy-to-use and interactive waterfall plot features.

Key Features Of Waterfall Chart

You can quickly design and modify your waterfall chart using our easy-to-use platform. QuickGraphAI makes it easier to do so.
You can choose from various chart types, including bridge charts, cascade charts, and stacked waterfall charts, to best represent your data.
You can enhance your data analysis with interactive features that allow you to explore and manipulate your charts in real time.
Here, everything is calculated locally on your browser, so your data is kept private and secure.
Our software is designed to be optimized for both desktop and mobile platforms, so you are able to create and explore charts anywhere.
You can seamlessly integrate your waterfall charts with other data analysis tools for a comprehensive data visualization experience.

Visualize Your Data Flow with Ease!

Create Dynamic Waterfall Charts in Seconds.

Process of Making a Waterfall Chart

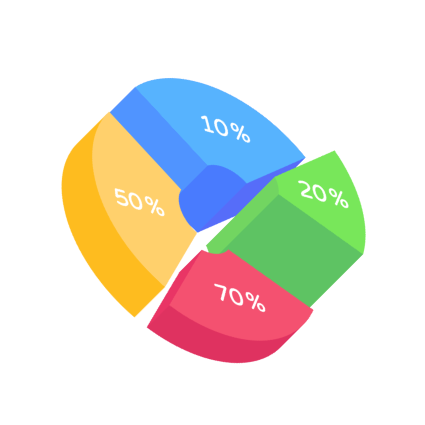
A step-by-step guide for creating a Donut Chart through QuickGraphAI Editor:
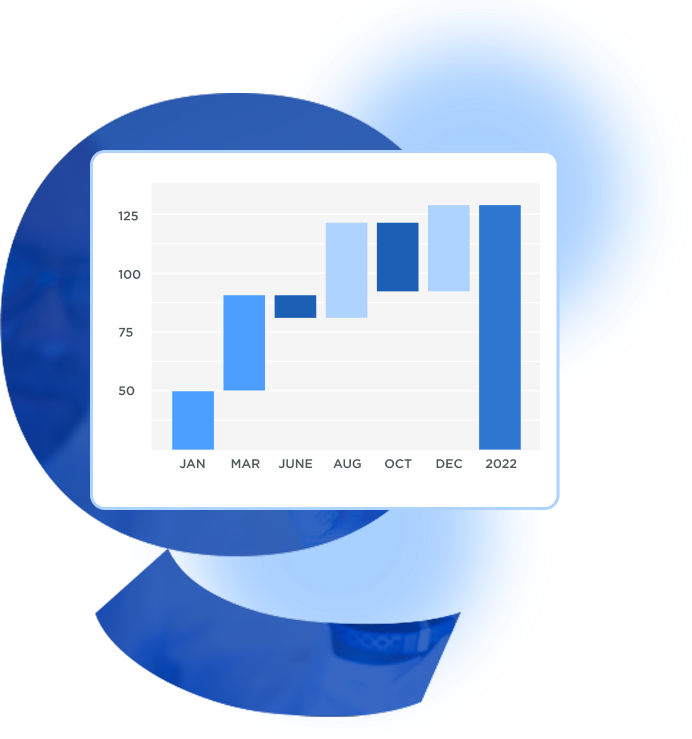
04

Create the Chart

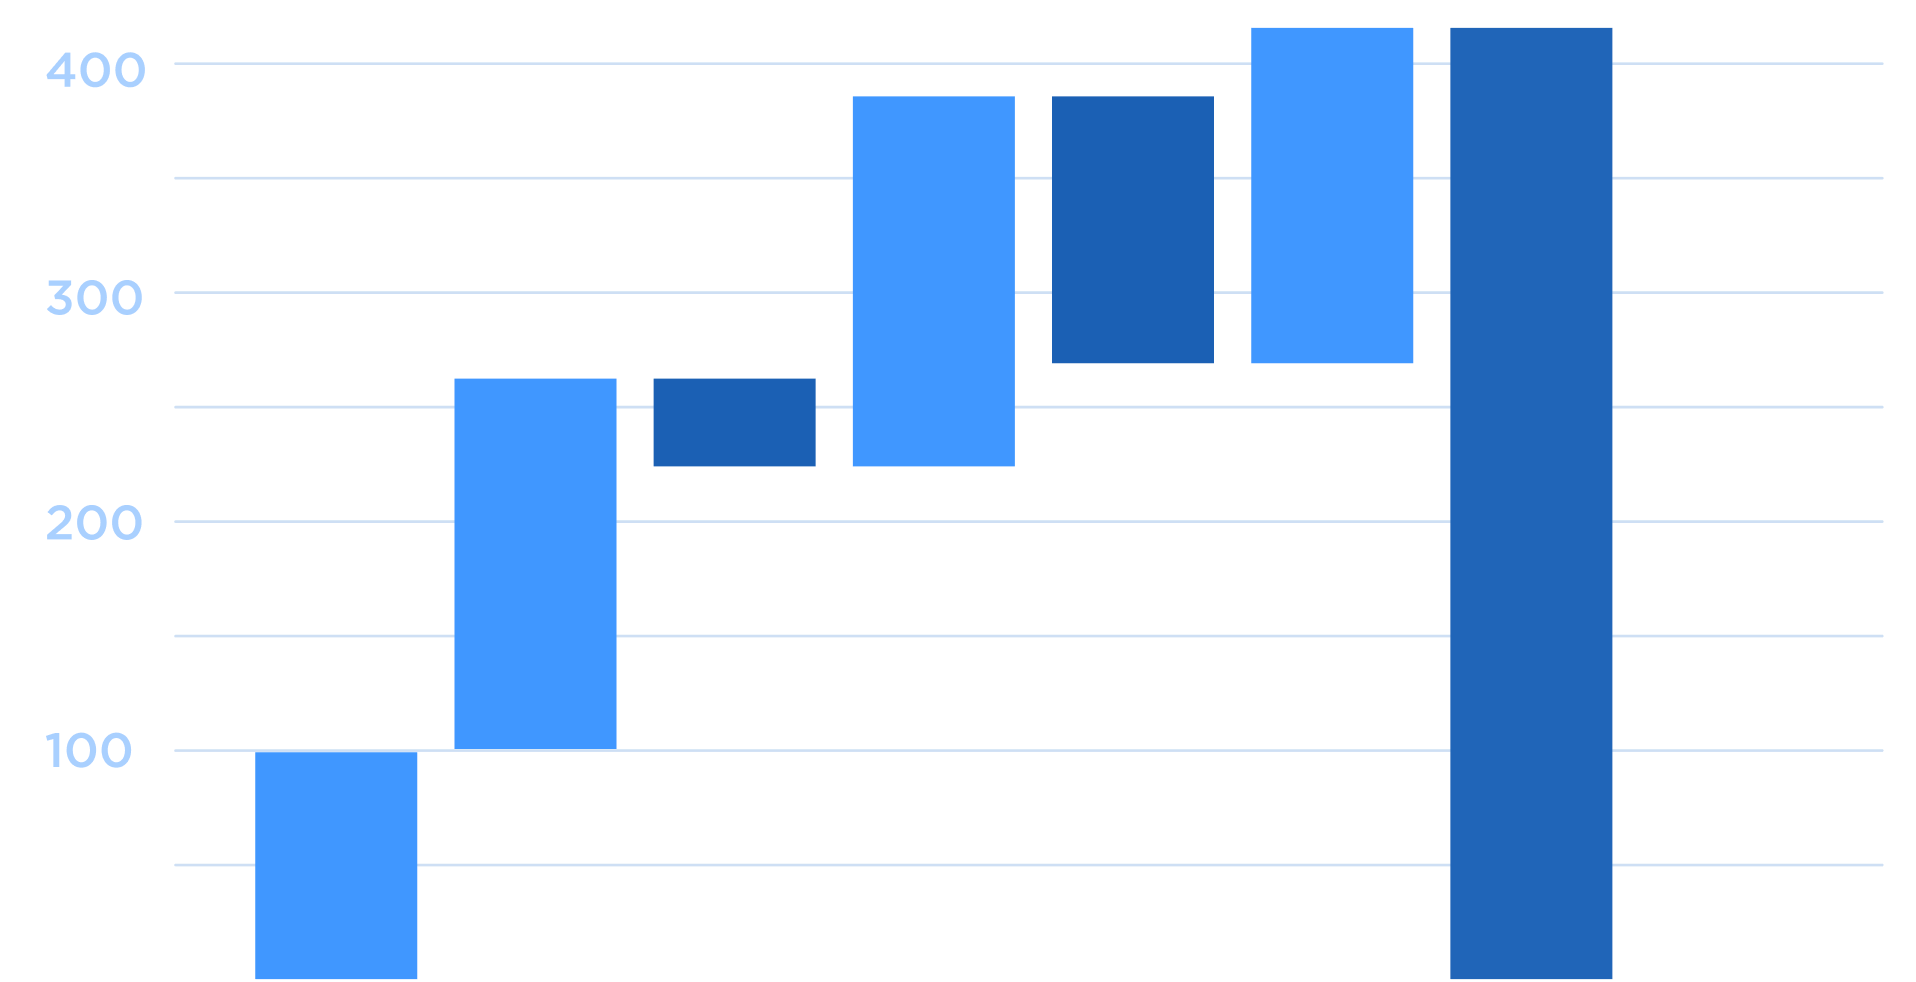
Select the waterfall chart option, also known as a waterfall graph, cascading bar chart, or incremental bar chart, from the chart menu.

06

Review and Finalize

Verify accuracy, ensure all changes are captured, and present your stacked waterfall chart for clear data storytelling.

Significance of Waterfall Chart

Frequently Asked Questions

A Waterfall Chart graphically breaks down the cumulative effect of consecutive positive and negative amounts, with it being simple to understand how each component contributes towards the whole. In QuickgraphAI, it makes it simpler for you to comprehend financial changes over time like revenues, expenses, and net profit.
Absolutely! With QuickgraphAI, you may upload data from numerous sources such as Excel spreadsheets, CSV files, or databases. Its integration ensures the inclusion of up-to-date, overall financial details in your Financial Waterfall Diagram.
The Waterfall Chart assists in determining the most important drivers of financial performance, including revenue growth, cost savings, and other major alterations. The chart offers an easy-to-understand visual indication of how variables affect your company's overall financial situation.
Absolutely! The Waterfall Chart in QuickgraphAI can be applied to forecasting by extrapolating future financial situations from past data. This aids in making sound business decisions and strategic planning.
In case of any problems, you can follow the QuickgraphAI support documentation or reach out to customer support for help. Standard debugging processes include verifying data correctness, validating proper data format, and confirming integration settings.
Donut-Chart-icon
line-graph-icons

Upgrade Your Data Visualization Dynamically

Get started today and see how waterfall and cascading bar charts can transform your data into dynamic actionable insights.