The current data-driven environment requires organizations to develop efficient methods for processing complex information because rapid comprehension of such information has become essential. The ability to produce results requires you to have more than basic information because your work requires advanced skills. The situation demands better understanding of all aspects this is where an AI graph maker plays a role by transforming complex data into clear, actionable insights quickly.
We will show 7 effective methods which an AI graph maker uses to make data analysis easier while explaining why QuickGraph AI has become a necessary tool in today’s work environments.
The main difficulty of working with data arises because people need to convert numerical information into useful insights. The presence of numerous rows and columns in tables creates visual challenges that make comprehension difficult.
With QuickGraph AI you upload your dataset and the system creates the best matching visual representation which includes either bar graphs or line charts or pie charts.
Instead of asking:
You can immediately see:
This instant visualization saves time and removes guesswork.
Traditional tools like spreadsheets require multiple steps:
In addition to being inaccurate, this method is slow.
The QuickGraph AI system handles all tasks through its complete automation capability. The system selects appropriate chart types through automatic selection while it applies professional design standards to the generated output. The following statement clarifies our previous explanation:
You focus on insights, not setup.
Manual data handling often leads to mistakes:
These errors can lead to wrong conclusions.
An AI graph maker like QuickGraph AI minimizes these risks by:
This results in more accurate and trustworthy insights.
Large datasets can be intimidating. AI graph maker break down complexity into easy-to-understand visuals.
For example:
QuickGraph AI helps you communicate complex ideas in a way that anyone can understand—even without a technical background.
In business and analytics, speed matters. The faster you understand your data, the faster you can act.
QuickGraph AI enables:
This allows teams to:
Instead of waiting hours for reports, you get insights in seconds.
Presentation matters. Whether you’re sharing data in a report, presentation, or social media post, your visuals need to look clean and professional.
QuickGraph AI automatically generates:
This ensures your visuals are:
You don’t need a designer AI handles the aesthetics for you.
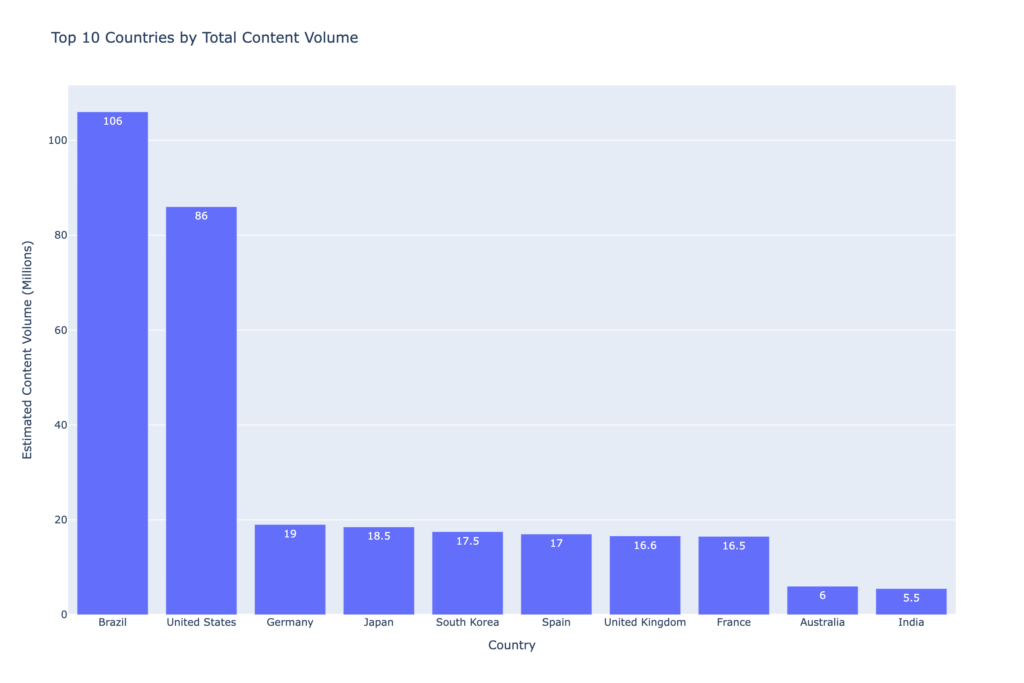
Instead of manually selecting chart types and formatting data, you can simply use a prompt like:
“Top 10 countries by total content volume.”
QuickGraph AI instantly generates a clean and professional graph based on this input.
Time is one of the most valuable resources, especially when working with data regularly.
By using QuickGraph AI, you can:
What used to take hours can now be done in minutes.
This efficiency is especially useful for:
While there are many tools available, QuickGraph AI stands out because it combines:
It’s designed for users who want powerful results without a steep learning curve. Whether you’re working with small datasets or complex analytics, it adapts to your needs and delivers clear, actionable visuals.
Data doesn’t have to be complicated. With the right tools, it becomes a powerful asset rather than a burden.
An AI graph maker like QuickGraph AI helps you:
You should improve your work routine because you continue to create charts by hand and face difficulties with spreadsheets. You should delegate your challenging tasks to AI while you concentrate on discovering essential information and implementing necessary steps.
The AI graph maker tool creates visual charts from raw data through its automated process which uses artificial intelligence technology to handle the task without human intervention while increasing precision of results.
QuickGraph AI analyses your data for you and produces a clear, professional-looking chart with well-integrated and instantly comprehensible graphs, making it easy for you to understand trends and patterns.
The design of QuickGraph AI enables all users to operate the software without any difficulties. Users who lack technical expertise or design experience can create charts.
QuickGraph AI and other graph maker tools are aimed towards handling and visualizing datasets from small to large.
The use of AI graph makers leads to time savings and decreased error rates while generating superior visualizations that surpass the capabilities of spreadsheet software.